AppMap Users: We are adding new features fast! Keep your extension up to date for access.
-
Docs
-
Reference
- AppMap for Visual Studio Code
- AppMap for JetBrains
- AppMap Agent for Ruby
- AppMap Agent for Python
- AppMap Agent for Java
- AppMap Agent for Node.js
- AppMap for Java - Maven Plugin
- AppMap for Java - Gradle Plugin
- AppMap Agent for JavaScript (legacy)
- Command line interface (CLI)
- Remote recording API
- Analysis Rules
- Analysis Labels
- GitHub Action
- License Key Installation
- Uninstalling AppMap
- Community
Trace View
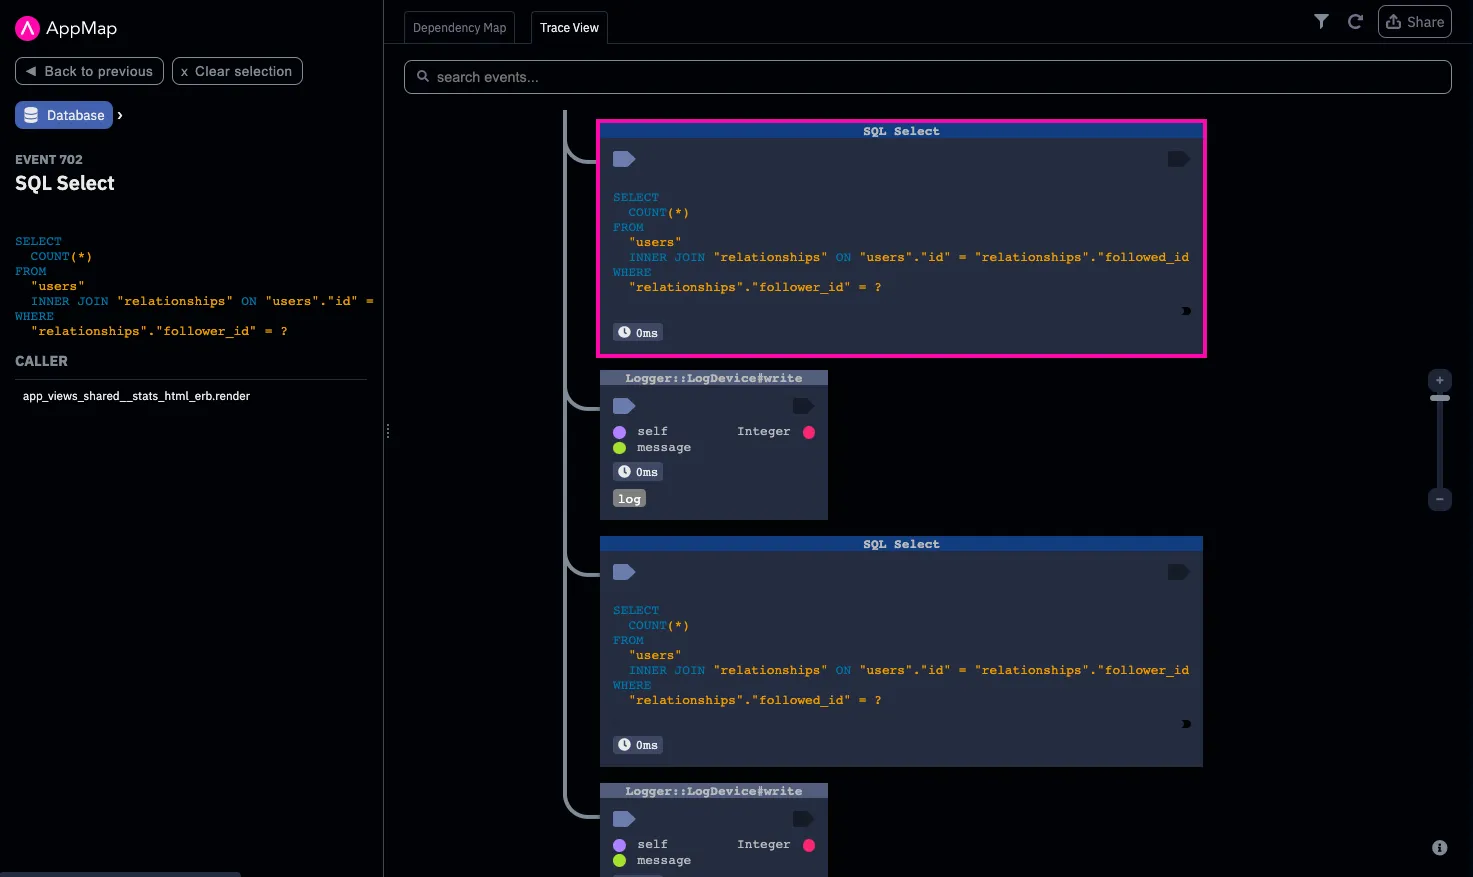
The Trace view diagram shows all the details of how a feature works. Here you can navigate forward, backward, up, and down through a detailed execution trace. See the call tree starting with web service endpoints going through function calls all the way to SQL operations. At any point, you can move quickly back and forth between the Trace view and your source code.
The Trace view is fully interactive. You can:
- Expand and collapse execution paths
- Explore callers and callees
- View variable names and values at any point in the code flow
- View SQL queries
- Open source code right to the line of any particular function

Expand and collapse execution paths
Explore callers and callees
View variable names and values at any point in the code flow
View SQL queries
Open source code right to the line of any particular function
Thank you for your feedback!
