-
Docs
-
Navigating AppMap Diagrams
In this video
We walk through how to navigate your AppMap Diagrams. We’ll dive into the various sections of the AppMap view, such as the dependency view and the trace view. And we’ll show you how to better understand your code execution by traversing your AppMap and how to link back to your codeLinks mentioned
Rails Sample Application
Appland VS Code and JetBrains Extension
Follow along
Welcome to AppMap. If you’ve been following along this tutorial, you should have AppMap Diagrams generated from either your test cases or from a remote recording. This tutorial assumes you have at least one AppMap created, but ideally more than one. As always you can clone this sample project repository from Github and follow along.
In this tutorial, we are going to dive into our AppMap Diagrams, show you how to navigate them and how to connect an AppMap back to your code.
We’ll start by opening the AppMap extension installed in our VS Code editor. You’ll see a listing of all your AppMap Diagrams in your left hand column. From here, we can select on an AppMap to open it.
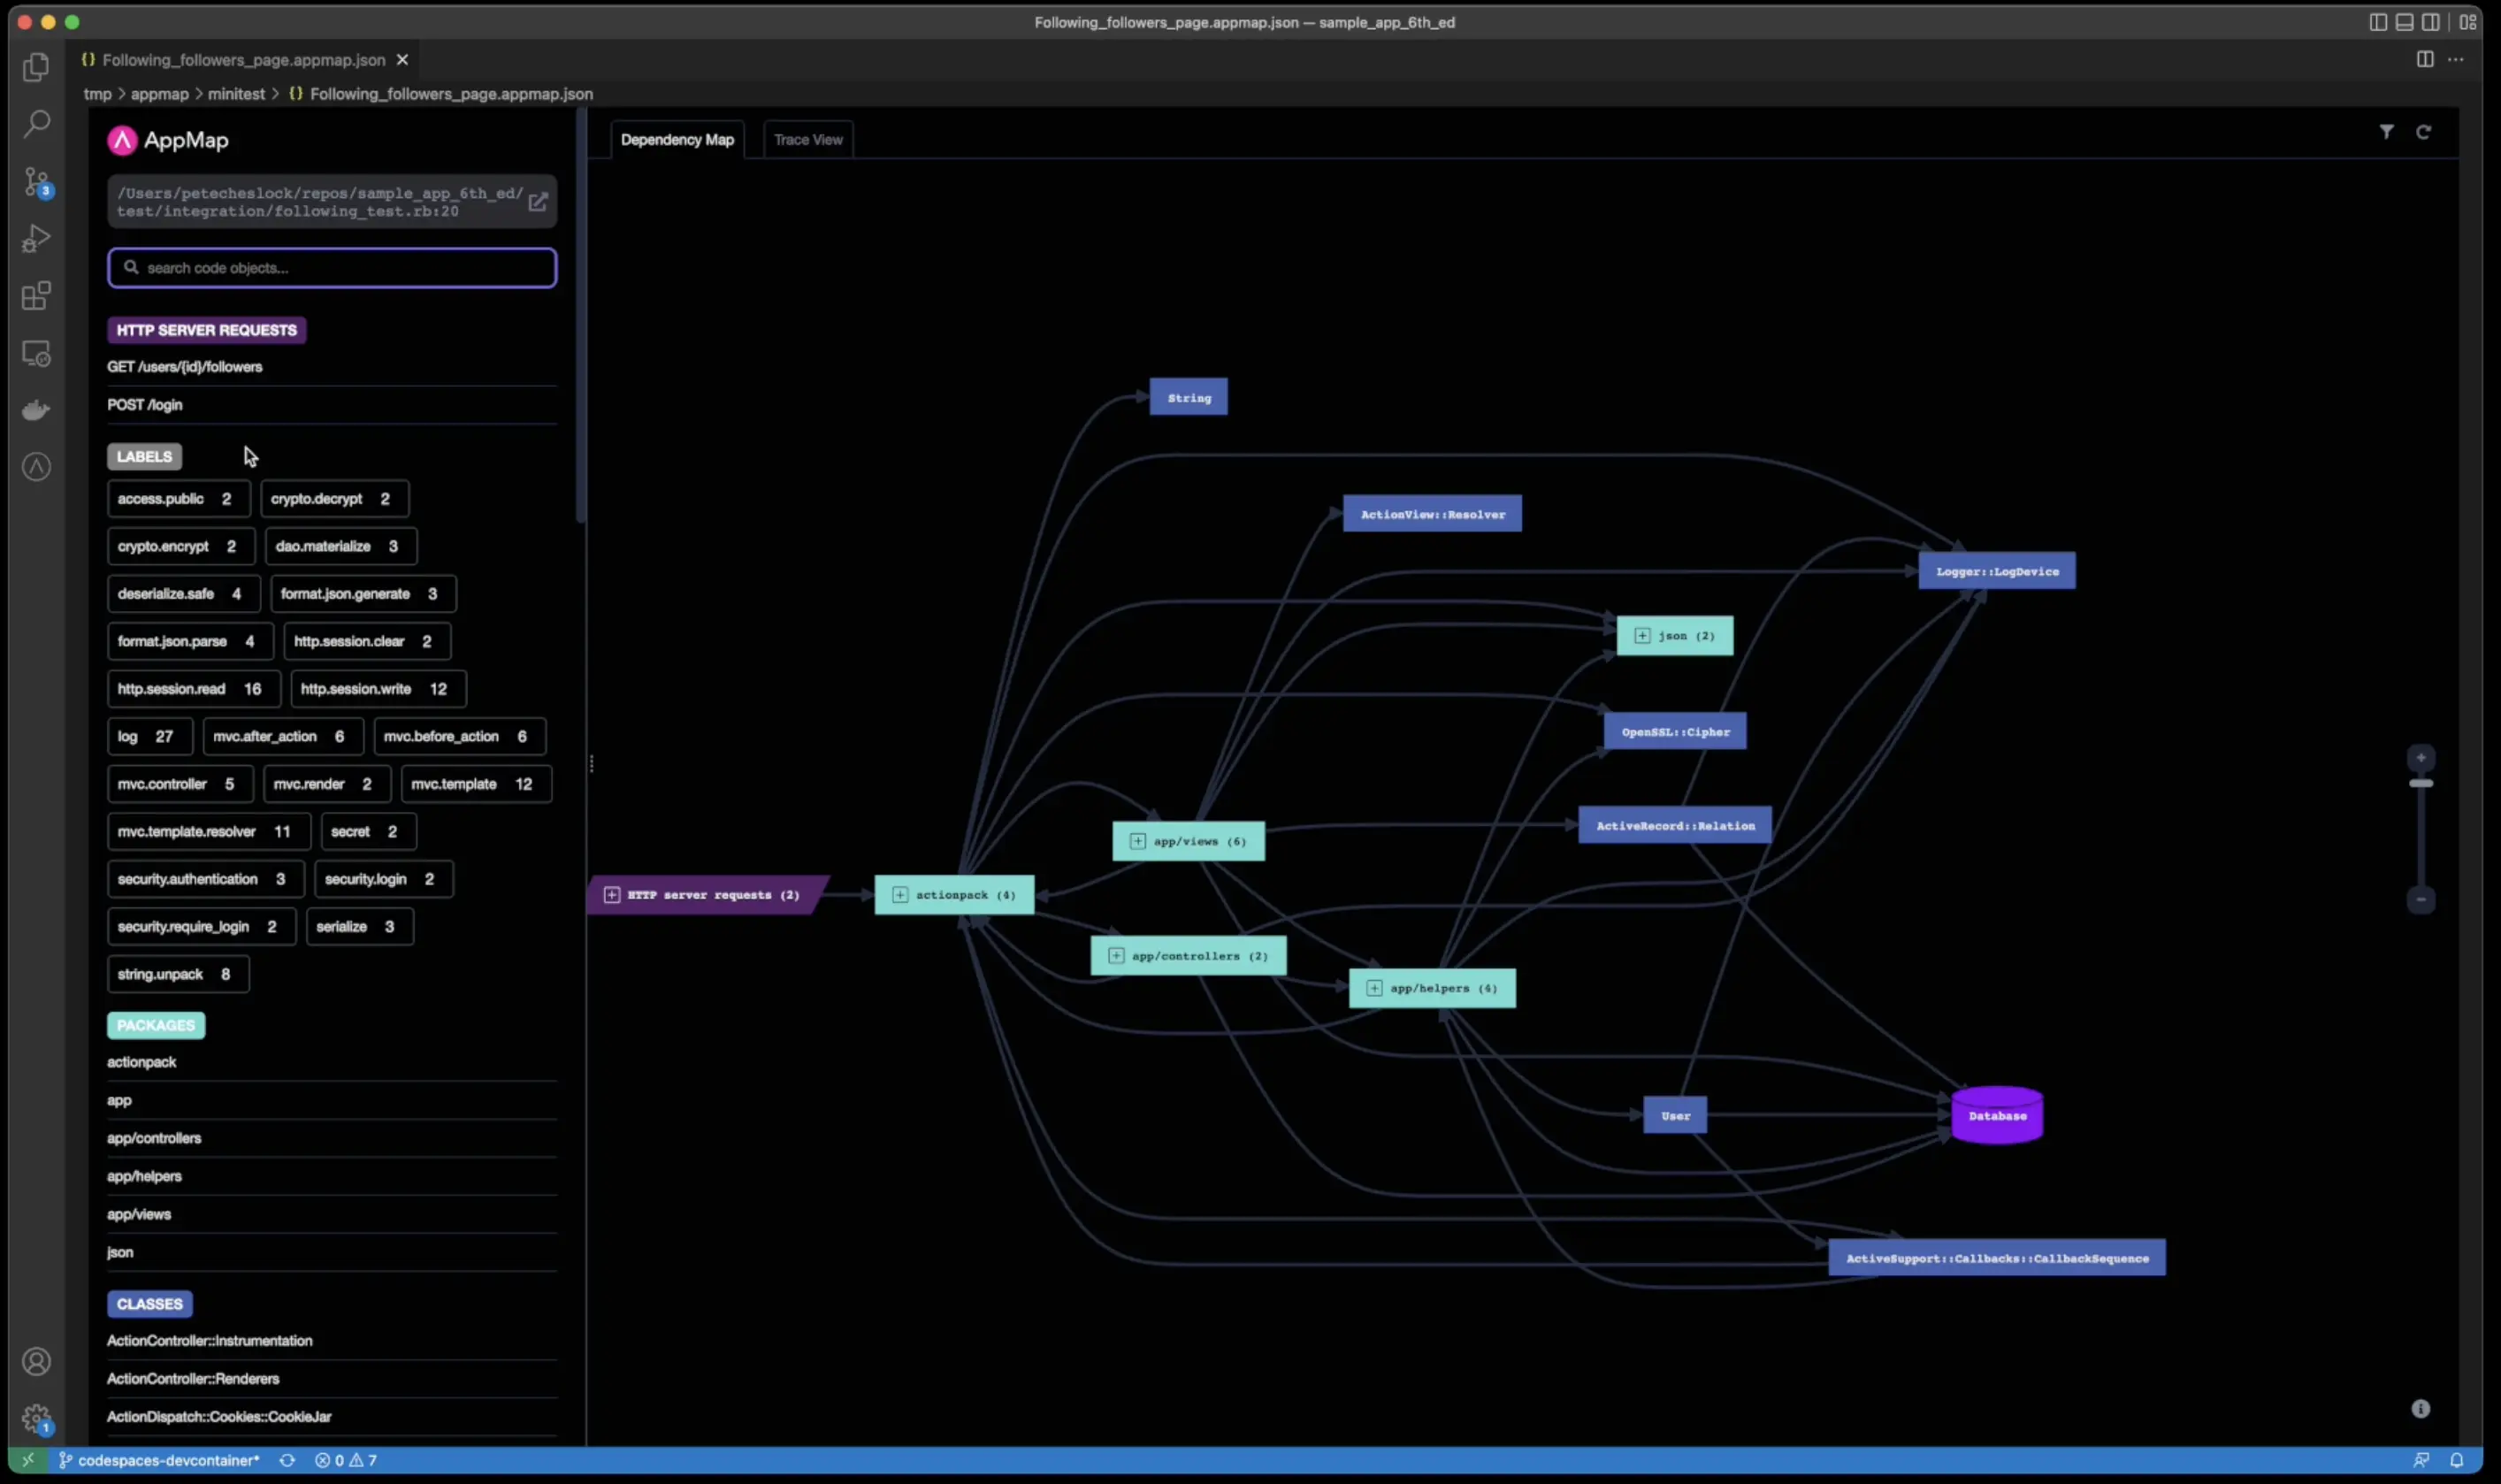
There are 3 main sections to an AppMap. The left hand column will show you HTTP requests, labels, either automatically generated by AppMap or manually extended via simple code comments within your code base, a list of all the packages, classes, functions, and SQL queries associated with this AppMap.
You can search across all of these code objects within this AppMap in the search bar and you can click the link to open the test case that generated this AppMap.
Dependency View
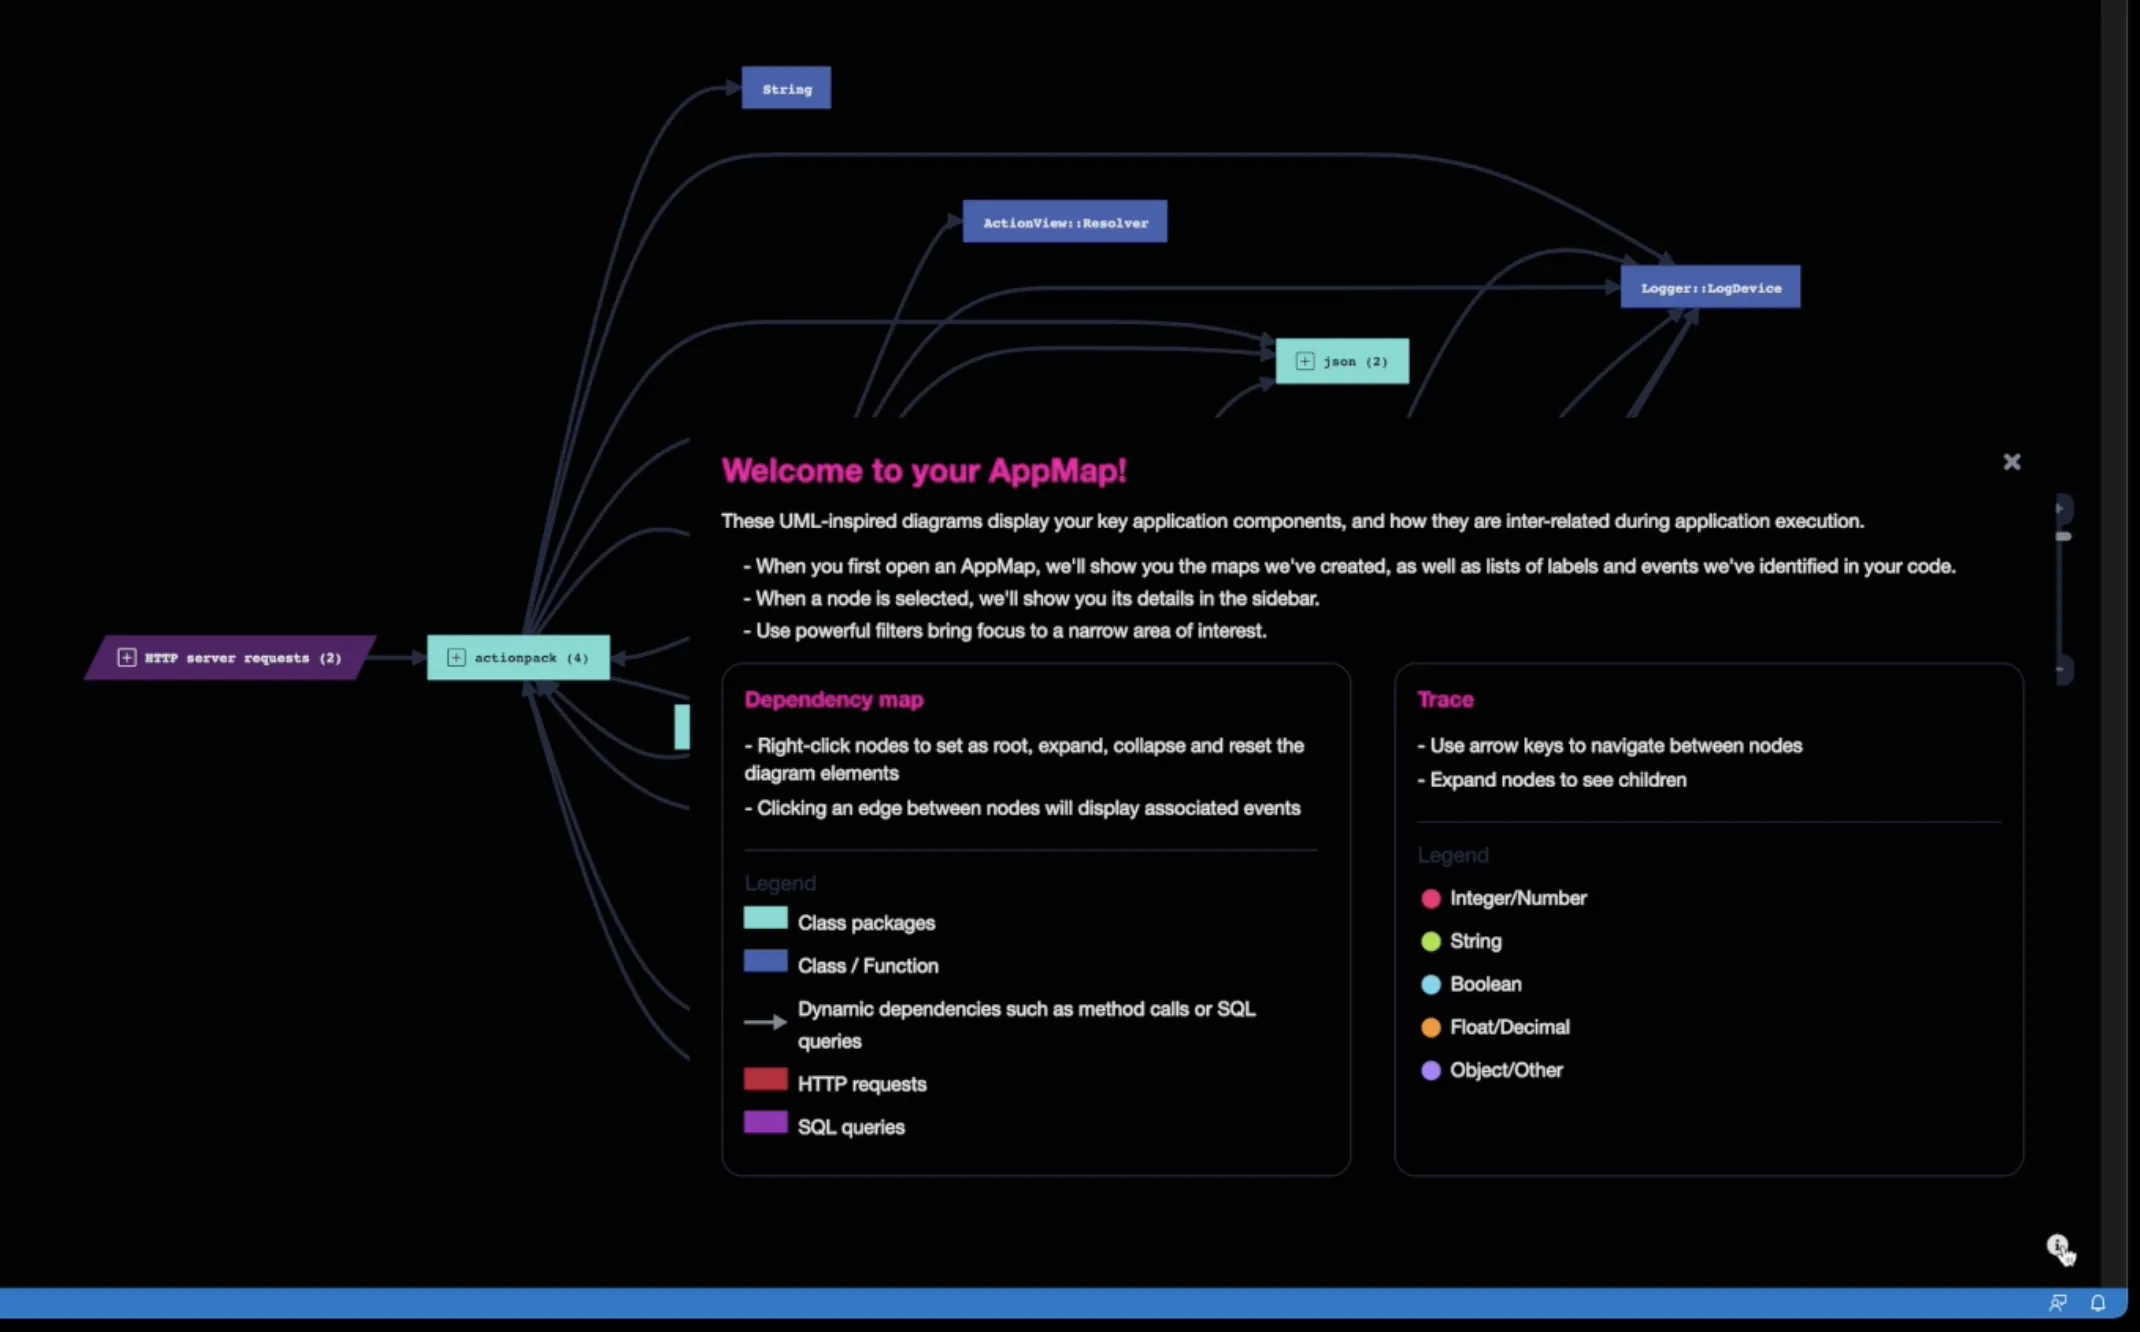
In the right hand section, you’ll see the Dependency view which shows a visual representation between the code objects, functions, and SQL queries. Click on the “information” icon to see a full legend for the code objects and data values.
In the top section, you’ll see a filter icon, click on this icon to help you declutter and focus your AppMap, which is particularly useful for larger and more complex maps. You can hide any unlabeled function, or hide specific packages, classes, or functions. For example, if I wanted to hide all of my logging functions from this AppMap, I can simply search for the
package:loggerand hide this from my view.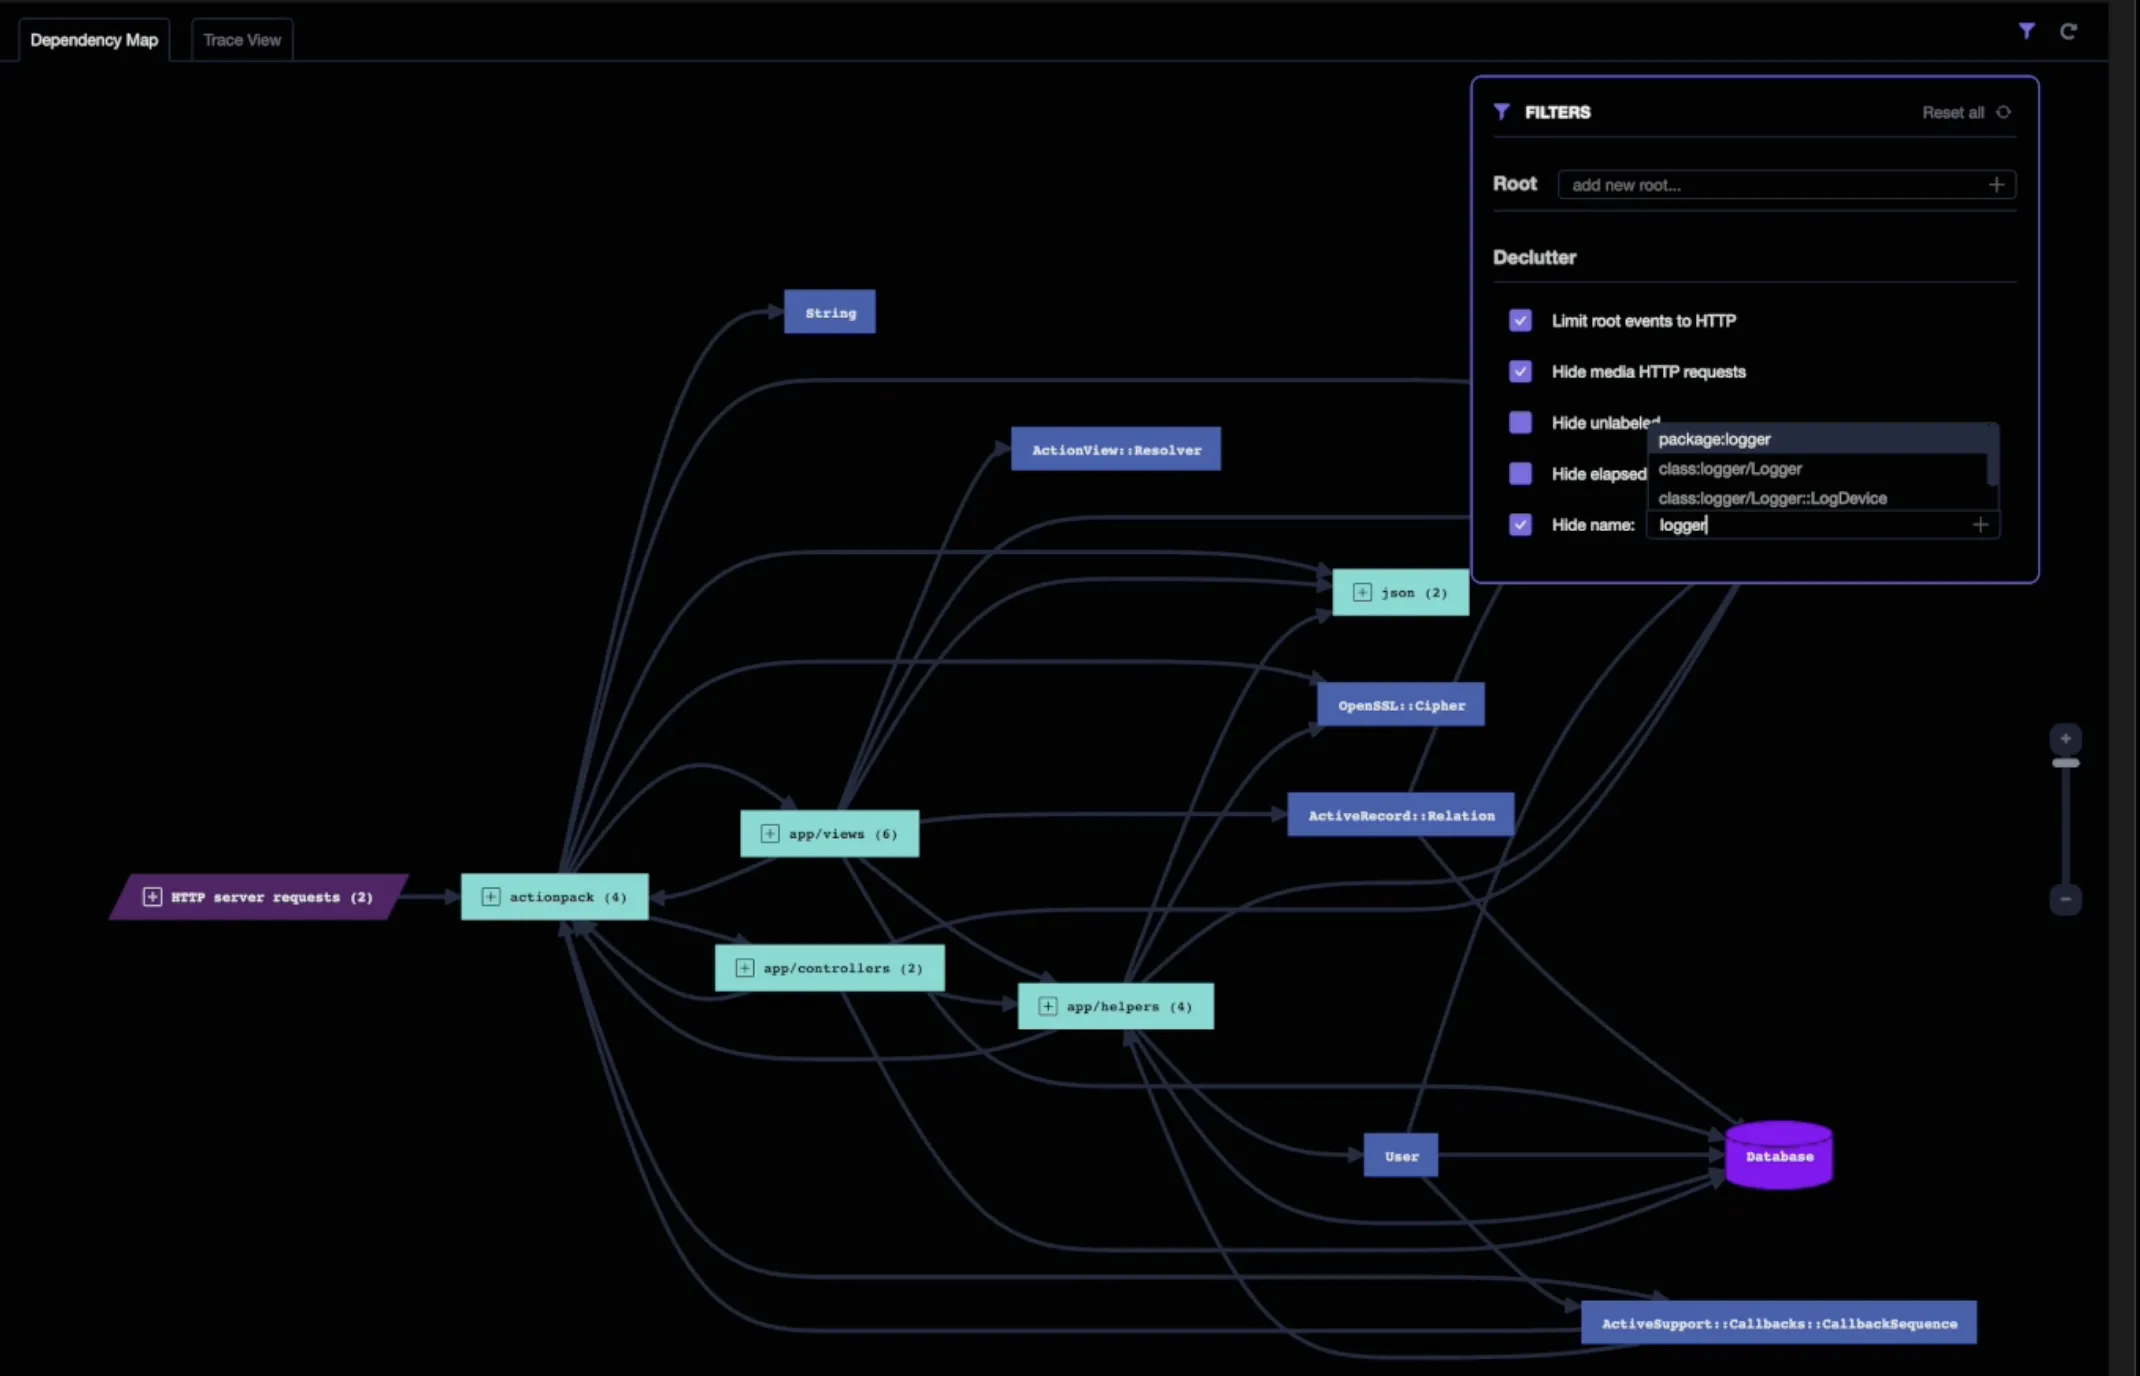
Trace View
If we click on one of the classes, such as
LoggedInHelper, and select on the function, we can click on the event and go to the trace view of this AppMap.The trace view shows a hierarchical tree structure of what happened within that particular web request. If I keep clicking on
calleri will get to the root which is the http server request. I can see the controller and the return status.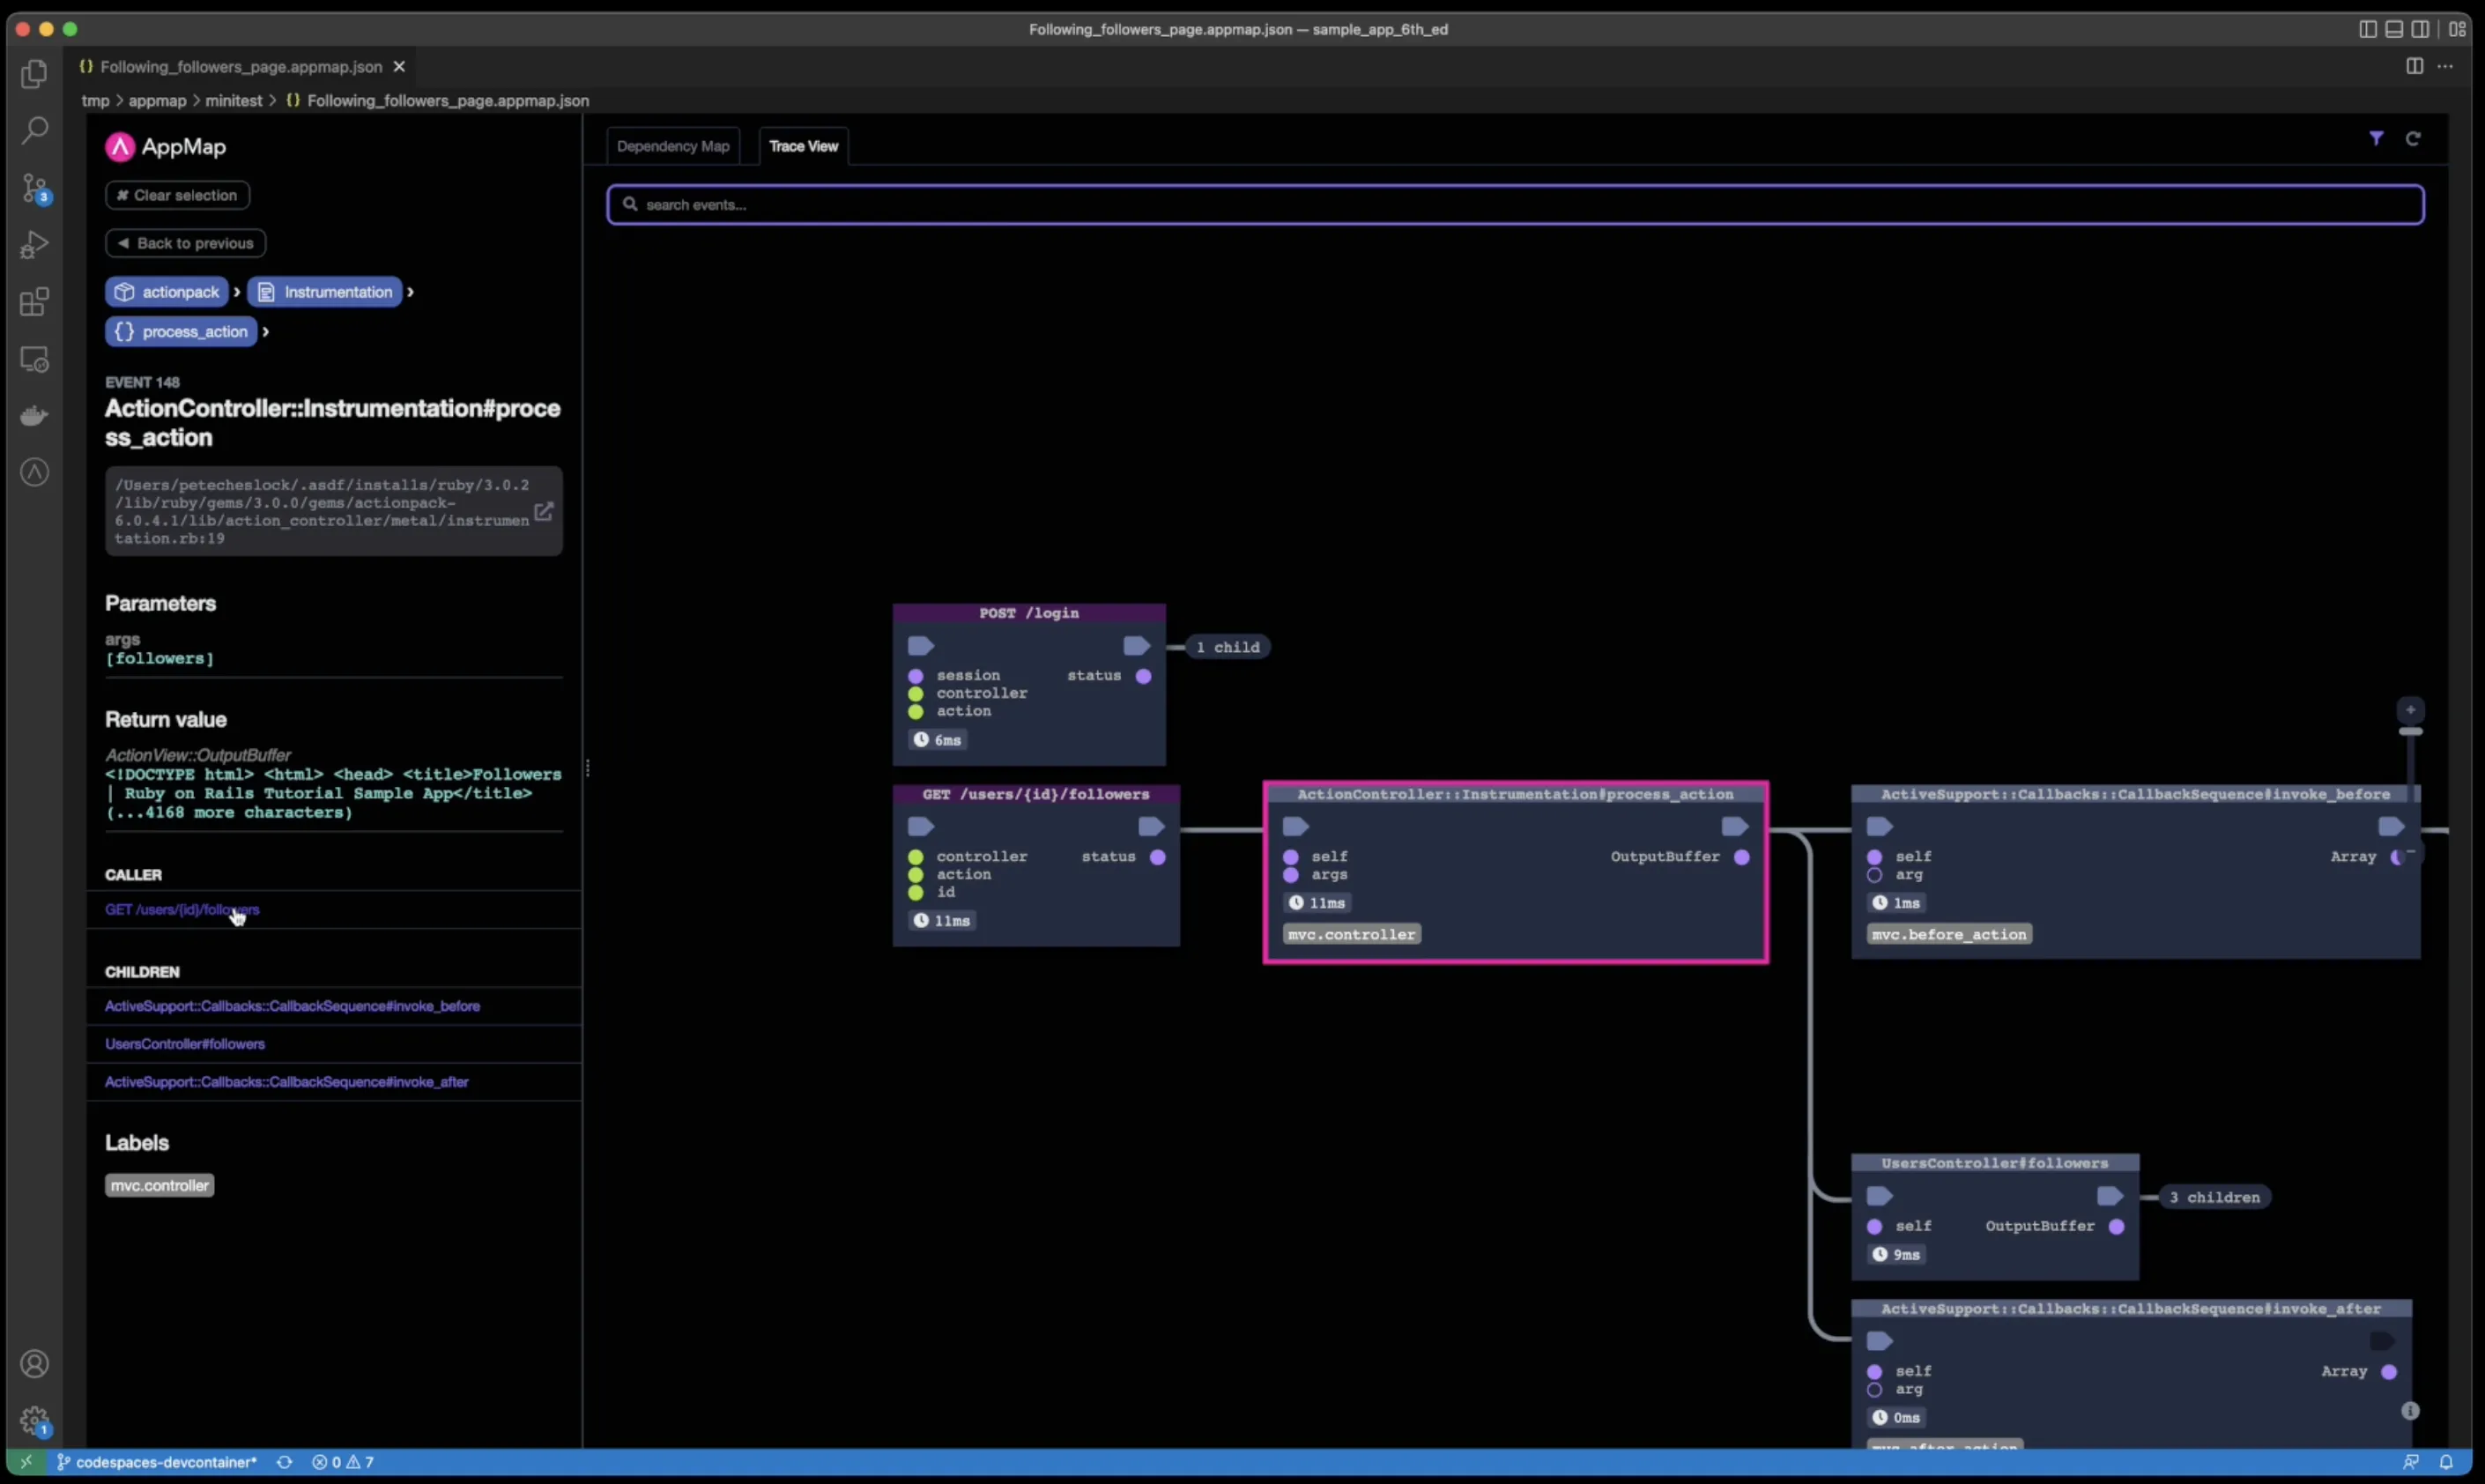
I can see the values of the variables, parameters, and return values as the code traversed this test case.
Thank you for your feedback!
