-
Docs
-
Generate AppMap Data from Tests
AppMap integrates with popular test frameworks, so you can automatically record an AppMap from each test case that you run.
Some benefits of test case recording include:
- Named for the test case The name of each AppMap corresponds to the name of the test.
- Includes source location The AppMap metadata contains the path and line number of the test case. From the AppMap Diagram, you can navigate to the test case code.
- Supports incremental testing AppMap’s dependency analysis capability can help you re-run out-of-date test cases as you modify the code - even in very large repositories.
For details on test case recording, see:
In this video
We install AppMap into our sample Ruby on Rails project inside of VS Code. You can find a link to the sample project below if you would like to follow along.Links mentioned
Rails Sample Application
AppMap Slack community
Follow along
You can review the previous video for more details about what the ideal types of projects for AppMap are. We’re using a Ruby on Rails sample app and can use
bundle exec rails testto generate AppMap Data from test cases. This is how AppMap will analyze the runtime of the code.Install AppMap agent
NOTE: If you’re using JetBrains IntelliJ IDEA with Java, follow these instructions to create AppMap Data from tests.
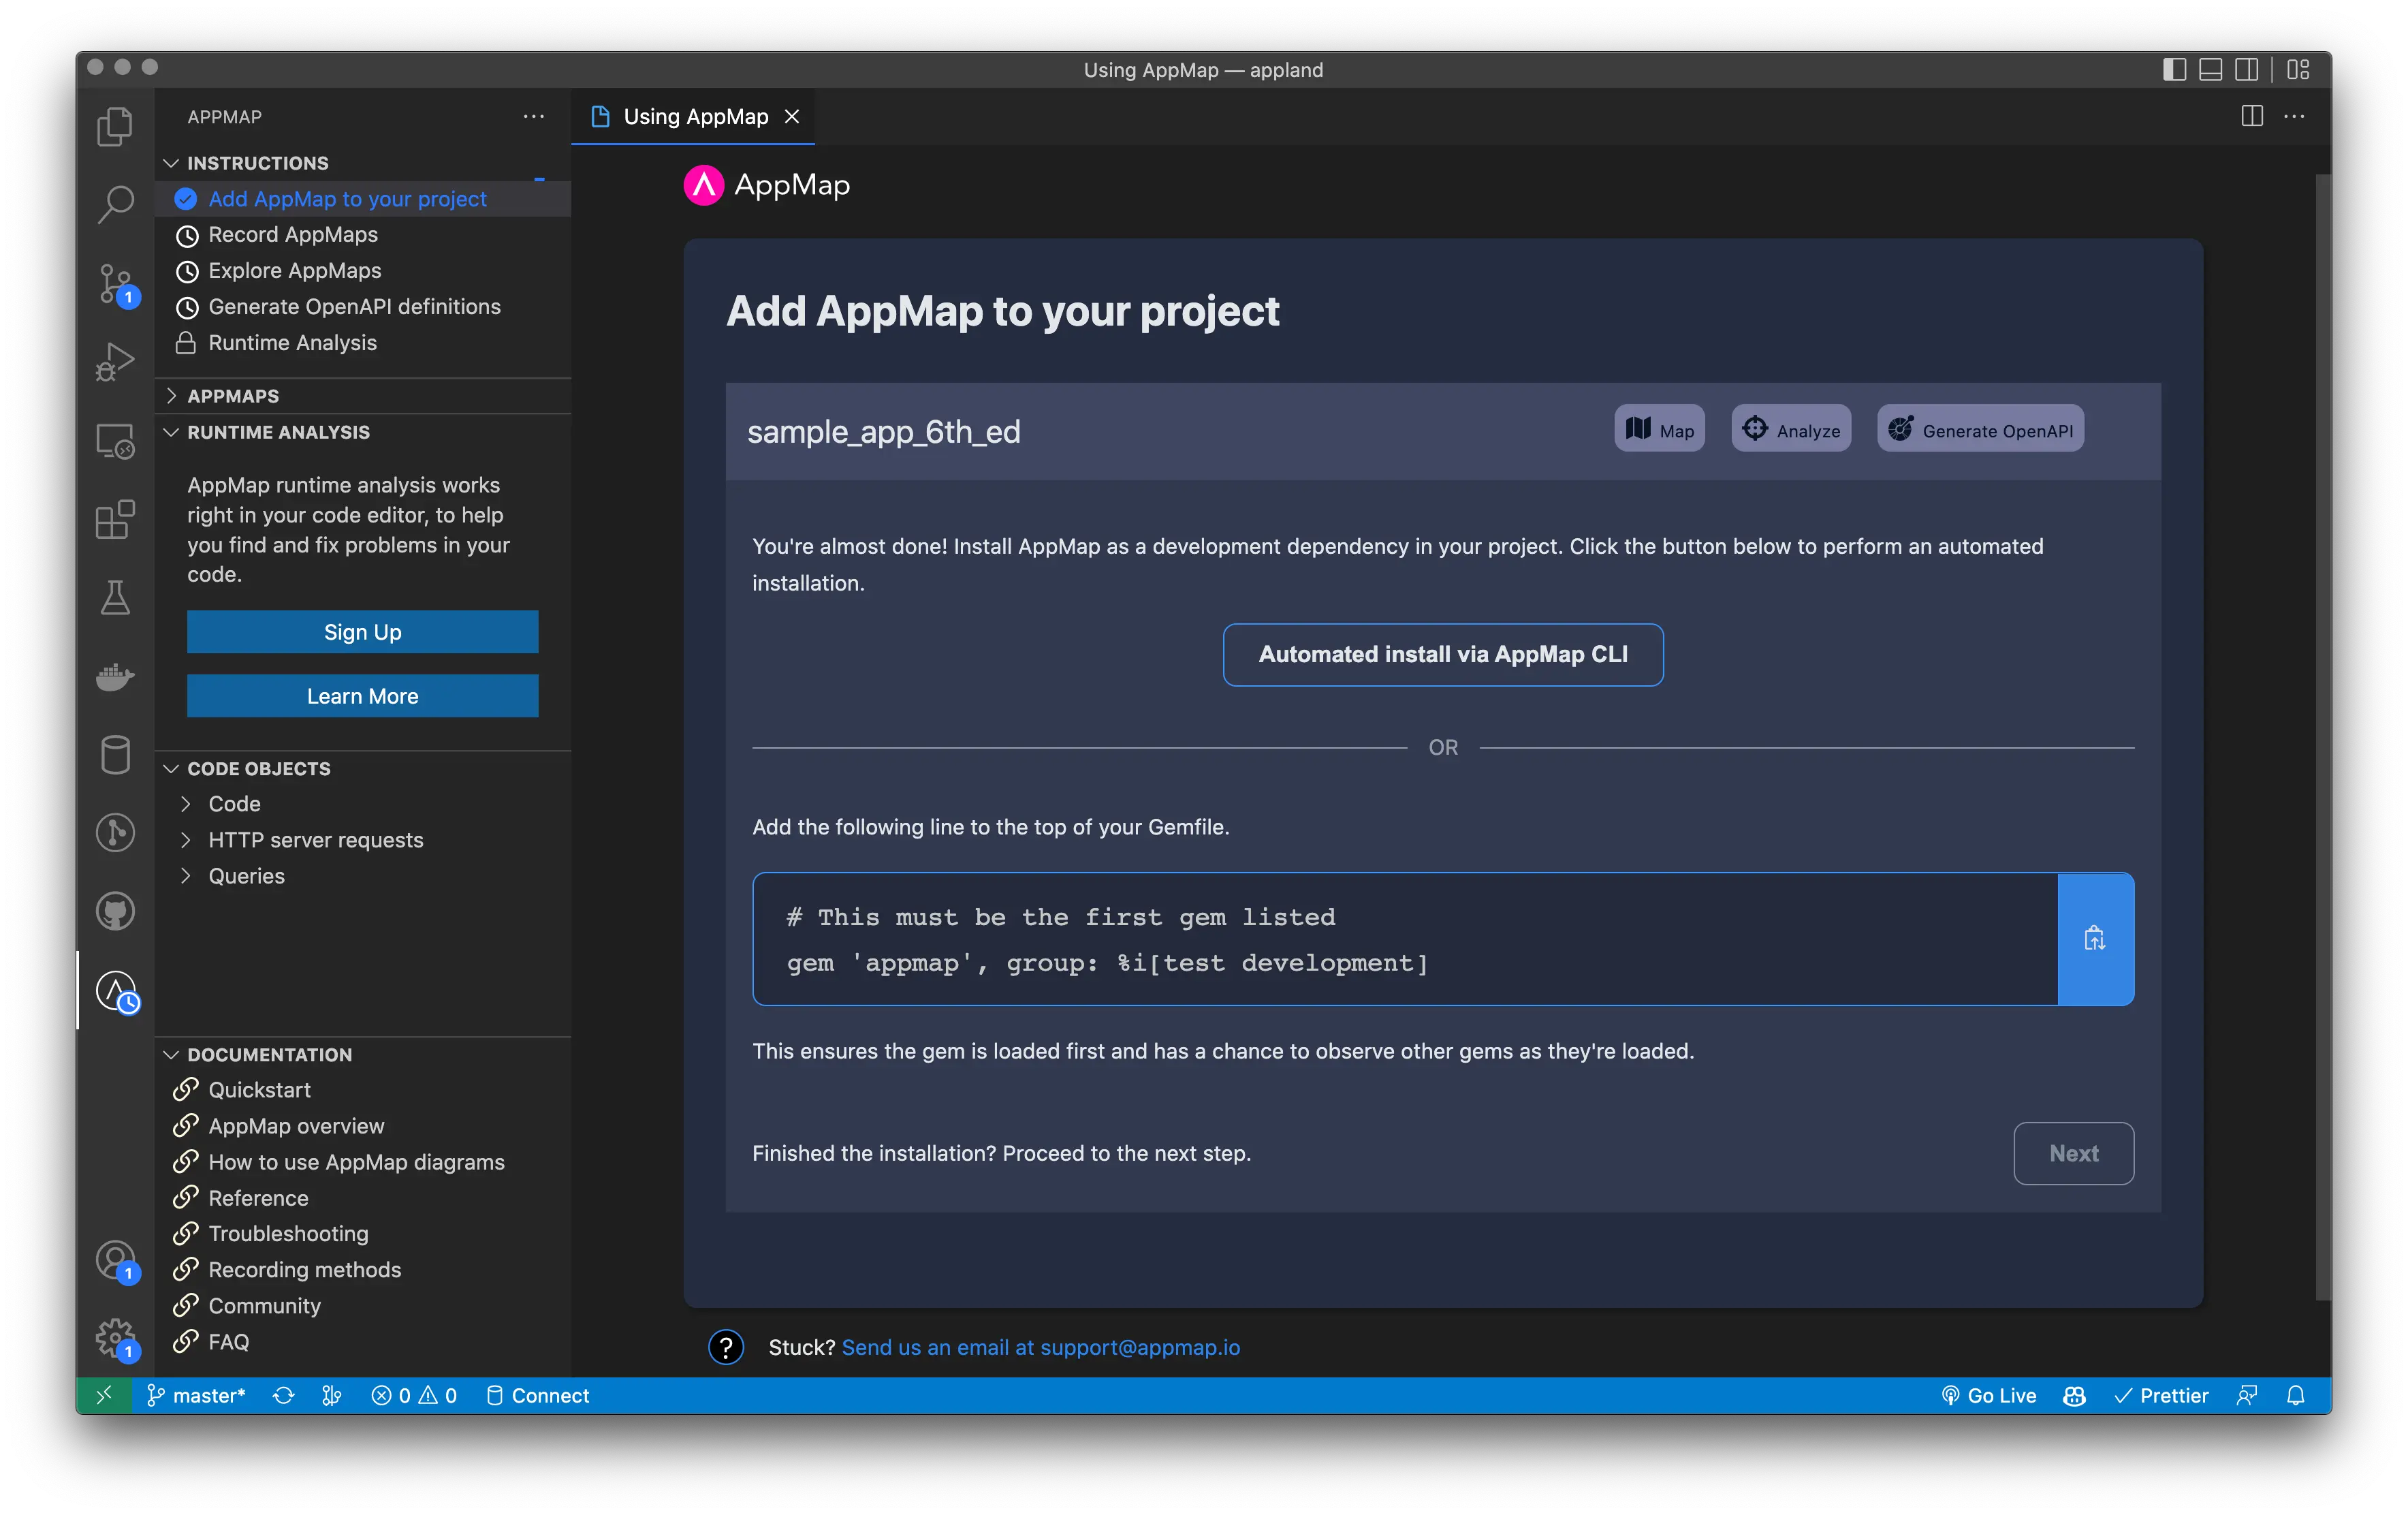
From here, navigate to AppMap by clicking on the button in the left hand sidebar, and click on “Add AppMap to your project”. The project picker will help you confirm that you’re running a suitable project before you install.
The automated installer will look for project files such as a
Gemfileor apackage.jsonand it will ask you to confirm the details of your environment before installing.Choose an installation method to continue.
In the video example the automated installer identifies both
yarnandBundlerbecause the project consists of a Ruby on Rails application with additional frontend JavaScript dependencies. In this case we want to record our Rails server, soBundleris selected as our installation target.Once the agent is installed correctly, continue on to the next step, recording AppMap Data.
Recording AppMap Data
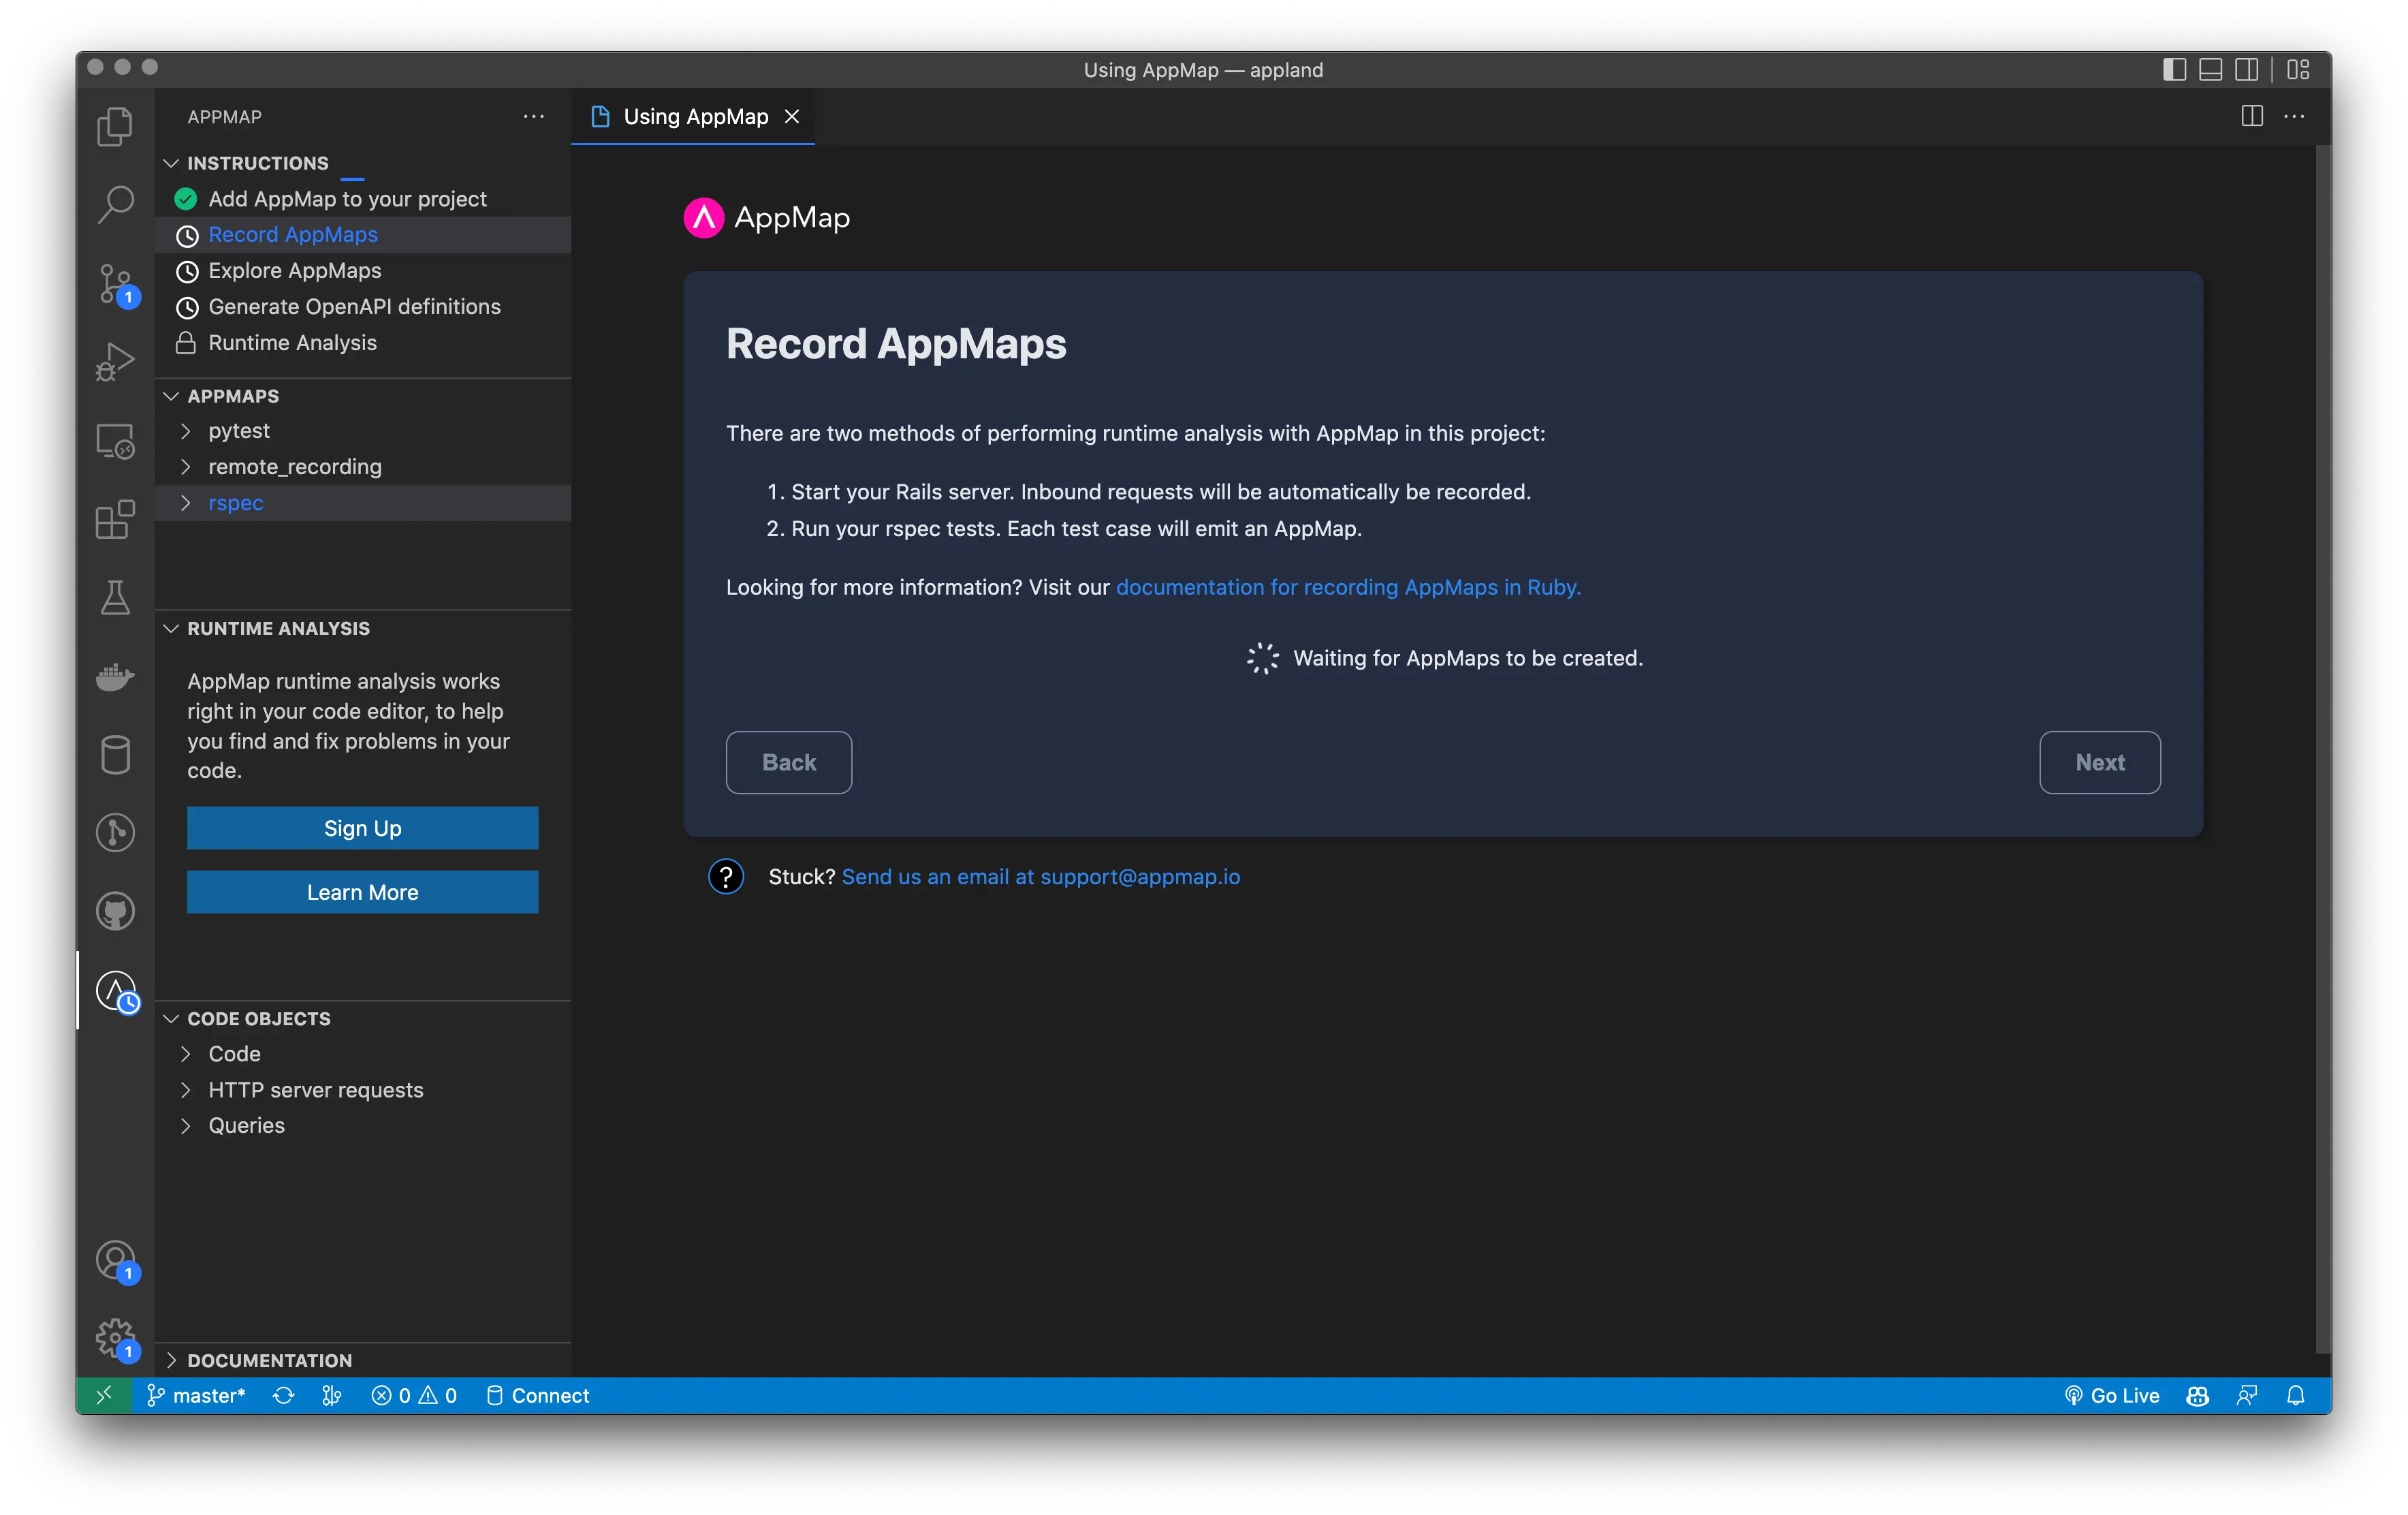
Follow the on-screen instructions for recording AppMap Data for your project. You’ll receive one of the two following options.
You may be given a command to copy and paste which will guide you through running your test cases with AppMap enabled. Paste the command into a terminal and it will ask what you want to use for your test command. It will make an assumption based on your project. If the command you run tests with is different to what was suggested by the on-screen instructions, you can change this command by pressing no, then entering a new command and include any environment variables you need.
Confirm the test command and define the maximum time you want to spend running each test. Tests will run for 30 seconds in total by default before AppMap will stop recording. If your tests take longer than 30 seconds, specify a larger time period.
Alternatively, the instructions may prompt you to run your application or test cases as normal. In this scenario, AppMap will automatically be enabled and no additional steps are necessary.
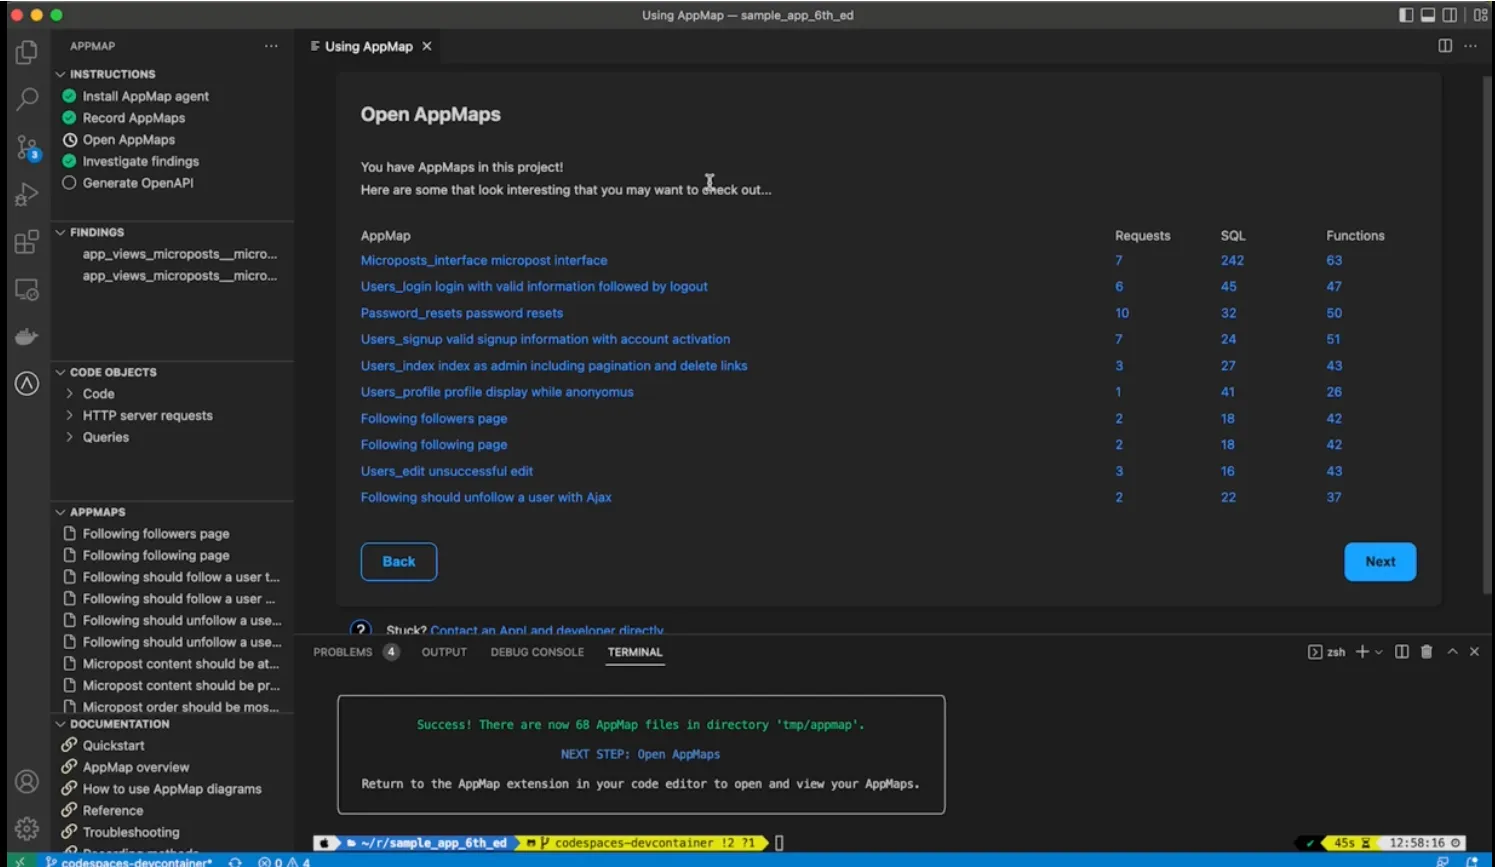
Open AppMap Diagrams
By running this command we’ve generated 68 AppMap Diagrams in our Rails sample project, and we can continue on to the next step. We now have AppMap Data that has been generated. We surface some of the AppMap Diagrams here, maybe ones that have a large number of requests or in this scenario, ones that have large numbers of SQL queries. You can click on any one of these to open the map directly inside of your vs code. You’ll be able to see which tests executed and generated this AppMap. You will also be able able to see server requests, packages, classes, functions, and SQL queries related to this.
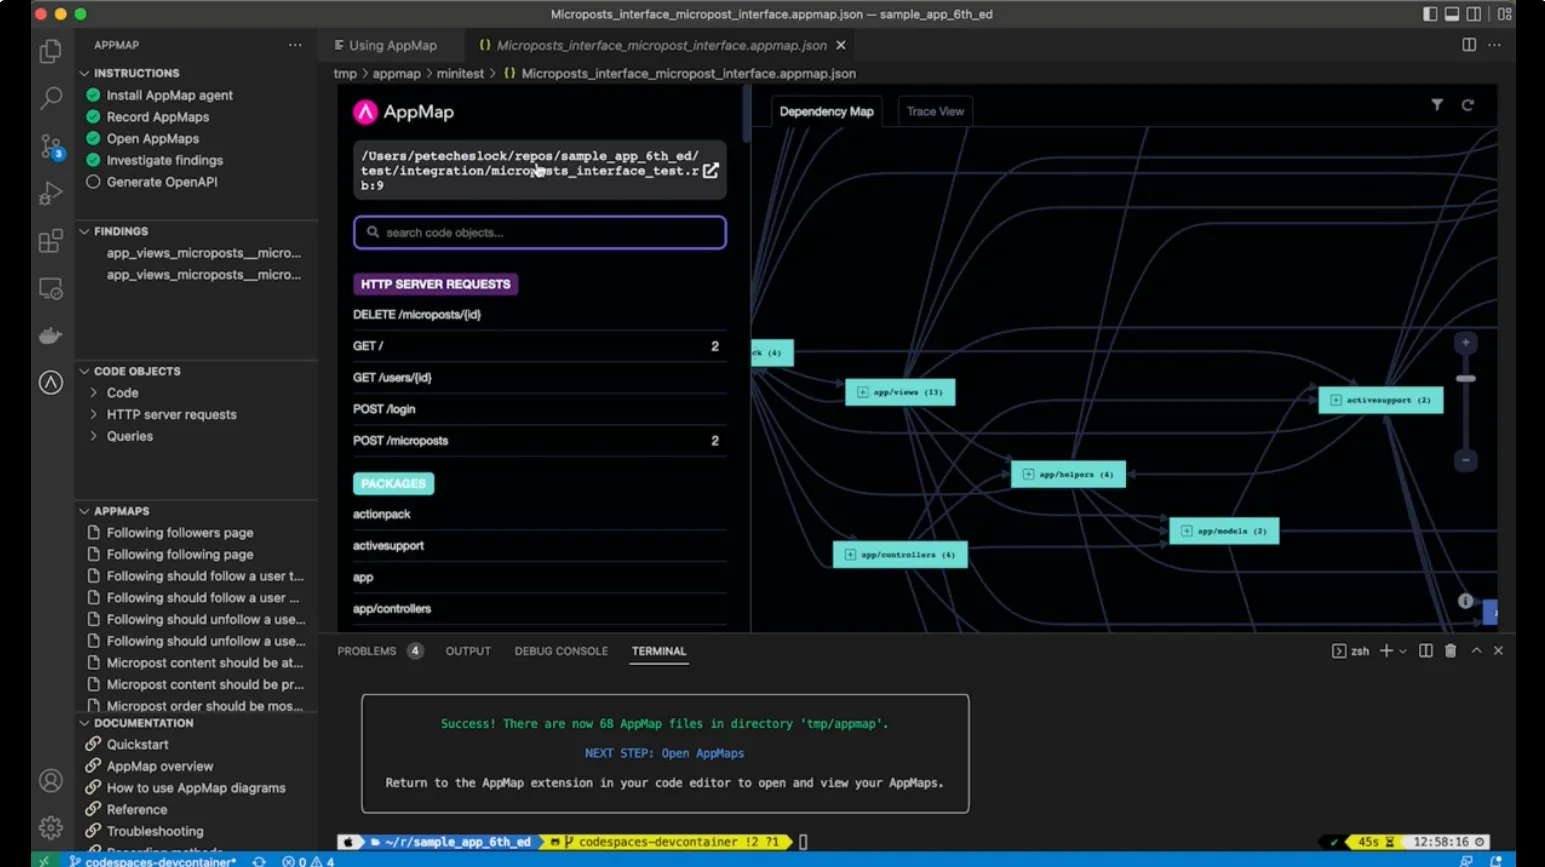
Investigate findings and view code objects
We’ll continue on the onboarding process and be able to view any findings that the analysis function has picked out. When we click on the “View Problems” button, we’ll see a series of N-plus-one SQL queries. These could lead to performance issues for your users. By clicking on any of these findings, it will navigate us into the code base where this issue is occurring.
You can also see code objects have been indexed. This is another helpful way to be able to find which AppMap Diagrams include which specific SQL queries or specific API requests. From here, you can see the changes that we’ve made in our project to support creating AppMap Data. The
appmap.ymlfile includes the command that we’re going to execute as part of our test run, as well as which paths within our project we’re going to analyze.And you can also see the
Gemfile. We include AppMap as a development dependency. You can commit all of these files, which will make this available to any other developers on this project.Finally, you’ll see AppMap Data actually exists inside your temp directory in the AppMap folder. We don’t recommend committing these to your project. They can grow your git repositories unnecessarily.
If you’d like to learn more about how to share AppMap Diagrams with your team, reach out to us on Slack for a preview of at maps team offerings.
AppMap is now installed in our project and by running tests locally with the AppMap flag enabled, we will be able to record AppMap Diagrams.
Thank you for your feedback!
