-
Docs
-
Handling Large AppMap Diagrams
Some AppMap Diagrams contain too much data and can be difficult to review. Often, these diagrams have many repetitive function calls that add a lot of data to the file, but don’t add much value when interpreting the AppMap. Large AppMap Diagrams are a potential indication that you should change how you’re recording by filtering out less valuable information. For example, you could exclude some calls to logging functions, or record fewer endpoints when manually recording.
AppMap Diagrams Over 10 MB
When you attempt to open an AppMap in a code editor extension that is over 10 MB, it will be automatically pruned down to ~10 MB. The most frequently called functions will be removed until the file is below 10 MB in size. (Don’t worry, the file will remain untouched because the pruning is done in memory). You will see notifications within the AppMap informing you that it has been pruned, and the pruned functions will be highlighted in the Stats panel:
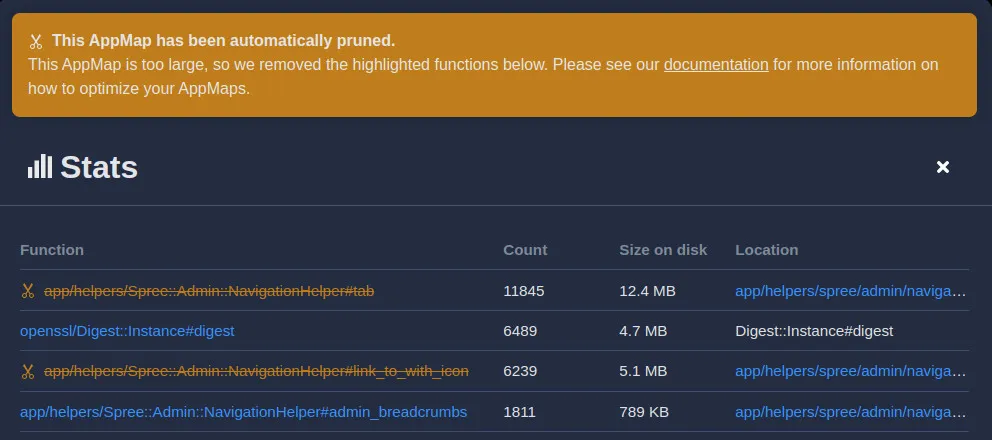
The automatic pruning might be sufficient, but if you want more control over what events are removed, you have two options:
- Use the
pruneCLI command to remove events from an existing AppMap - Change the configuration of your
appmap.ymlto exclude certain events when an AppMap is generated
AppMap Diagrams Over 200 MB
When an AppMap Diagram is over 200 MB, we will not open it in the code editor extension because it could cause performance issues on your computer. Instead, we generate statistics about your AppMap and open the Stats panel. Use this information to configure your
appmap.ymlto exclude these functions (see below). The next time that you generate your AppMap, it will be smaller because it will not contain the specified functions: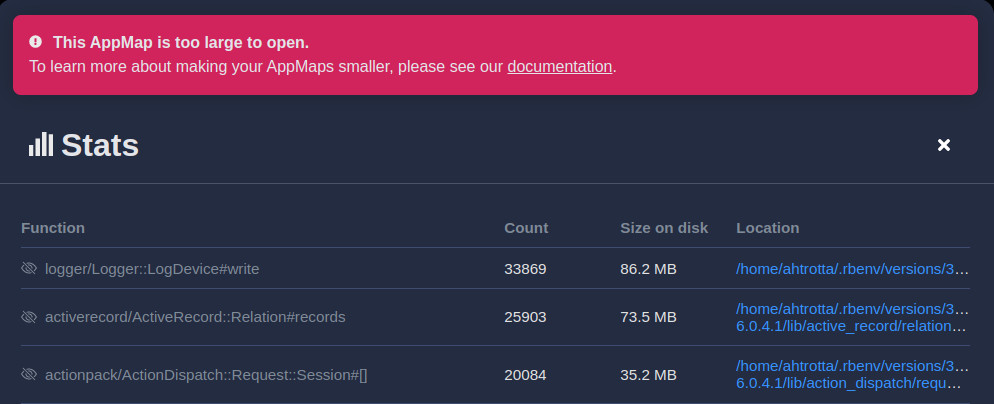
- Configure exclusions in a Ruby project
- Configure exclusions in a Java project
- Configure exclusions in a Python project
- Configure exclusions in a Node.js project
We do not recommend using the
pruneCLI command for AppMap Diagrams over 200 MB, because it loads the entire AppMap into memory, which may cause performance issues for your computer.Handle Large AppMap Diagrams in the CLI
For some AppMap Diagrams that are extraordinarily large, you may notice issues opening them in your code editor. In this scenario, you can use the AppMap CLI to analyze the statistics of the offending AppMap if you are unable to see the statistics in your code editor.
You can then use the details from the
statscommand on the large AppMap to properly exclude functions that are noisy and may not provide any useful insights (for example getters and setters).Here’s how it works.
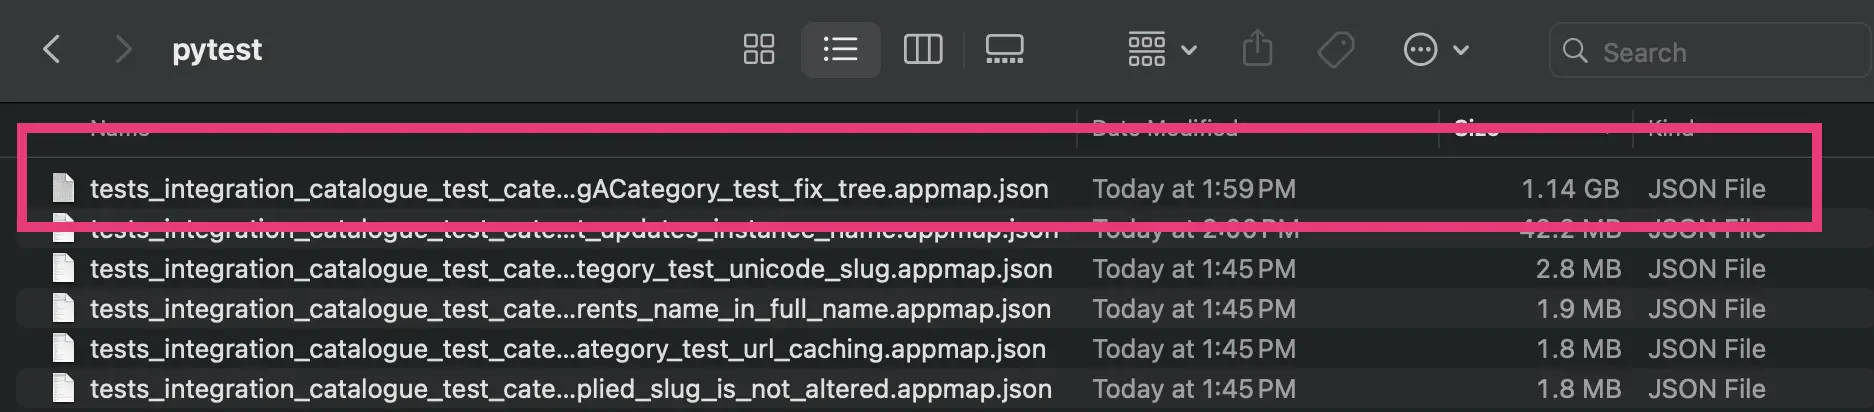
In this example, we have a specific test in our Python Django application that is generating a very large (over 1GB) AppMap. We’ll use the AppMap CLI to get information about the nosiest functions that we can exclude from a future AppMap recording.
First, you’ll need to ensure you have the AppMap CLI binaries installed on your machine.
If you have already installed the AppMap code editor plugin for JetBrains or VS Code, the binaries will already exist in your$HOME/.appmap/bindirectory.Otherwise, you can download the latest version of AppMap binaries on GitHub following this guide.
With your binary installed. We’ll run the following command to analyze the large AppMap to identify noisy functions to exclude.
For more details about how the AppMap CLI works and the stats command, refer to the AppMap reference guide.
In our command below, we’ll run the stats command pointing to the directory where the AppMap lives, and the name of the appmap (the file extension
.appmap.jsoncan be optionally added or omitted).$ appmap stats <directory containing AppMap Data> --appmap-file <name of the AppMap Data file>For example:
$ appmap stats tmp/appmap/pytest --appmap-file tests_integration_catalogue_test_category_TestMovingACategory_test_fix_tree.appmap.json
Analyzing AppMap: tmp/appmap/pytest/tests_integration_catalogue_test_category_TestMovingACategory_test_fix_tree.appmap.json

1. function:oscar/apps/catalogue/abstract_models/AbstractCategory#get_ancestors_and_self
      count: 1526529
      estimated size: 572.2 MB

2. function:oscar/apps/catalogue/abstract_models/AbstractCategory.fix_tree
      count: 1
      estimated size: 583.0 bytes

3. function:oscar/apps/catalogue/abstract_models/AbstractCategory#set_ancestors_are_public
      count: 1
      estimated size: 368.0 bytes
In our example the
get_ancestors_and_selffunction in theAbstractCategoryclass is the single largest offender and the main cause of the large appmap.We will now add an exclusion for this function in our
appmap.ymlconfiguration file.To learn how to add an exclusion to your project refer to the documentation below.
- Configure exclusions in a Ruby project
- Configure exclusions in a Java project
- Configure exclusions in a Python project
- Configure exclusions in a Node.js project
In this example we’ll exclude the
apps.catalogue.abstract_models.AbstractCategory.get_ancestors_and_selffunction from our mainoscarpython package.My updated
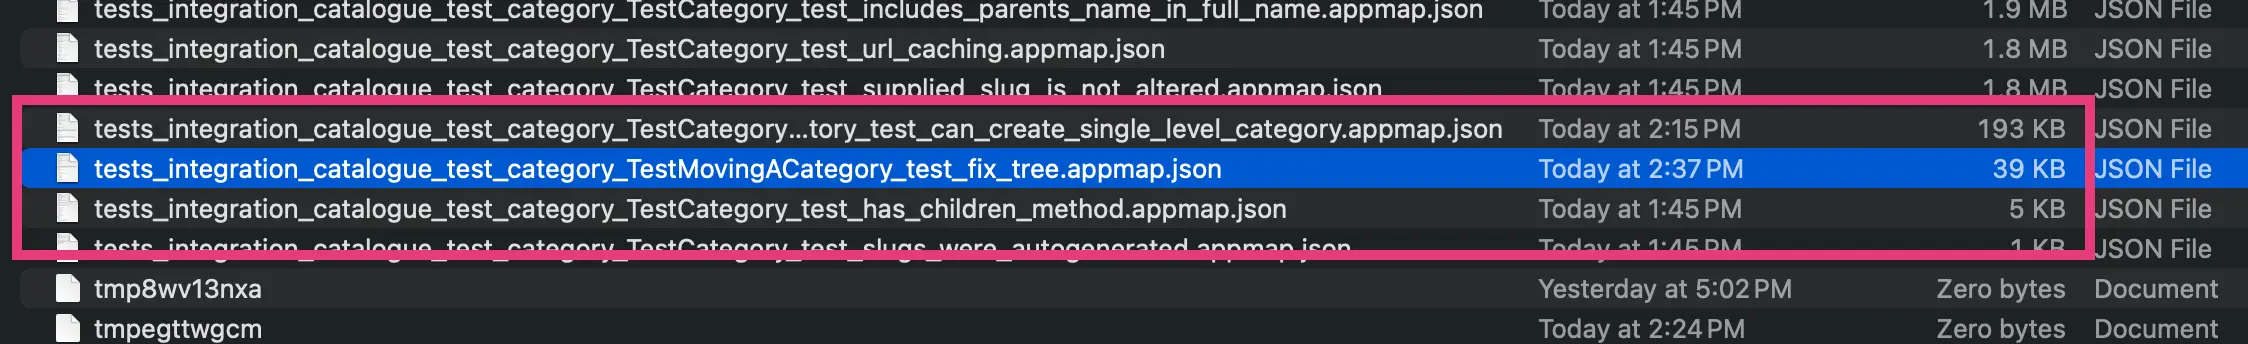
appmap.ymlnow looks like this:appmap_dir: tmp/appmap language: python name: django-oscar packages: - path: sandbox - path: oscar exclude: - apps.catalogue.abstract_models.AbstractCategory.get_ancestors_and_selfNow if I run my tests again, this noisy function will no longer be included within the AppMap and the size of the file will be significantly reduced.
Video Tutorial
Thank you for your feedback! - Use the
