
Almost always, the fastest way to address bugs is to first be able to replicate them in your local environment. By verifying that you can replicate the issue locally, you can reduce your mean time to repair (MTTR) when responding to an incident or ticket.
As of today, the free, open source framework AppMap can tell you if you can replicate a performance bug locally, because now AppMap shows you performance data locally in your dev environment. You can compare this AppMap data to a reported issue to verify that you can identify and replicate a performance issue.
Beyond verifying that the issue can be replicated locally, AppMap captures the entire context of code being recorded and executed, and provides performance data at every step. This context includes snapshots of data which may contribute to or directly lead to performance issues. By providing you with everything you need to remediate the issue, AppMap has an edge over traditional profilers.
Once you identify the root cause and make your fix, comparing AppMap’s before-and-after performance data allows you to confirm that you’ve addressed the performance issue (in addition to any associated test cases). These before-and-after data can also be shared in a post-mortem to communicate the problem, attached to a ticket that describes the fix, and saved in a knowledge base (to help prevent the issue from happening again!)
Here’s a brief demo of how to quickly troubleshoot and verify a fix of a performance issue in a popular community site application using AppMap. (FYI, we’ve modified this community app slightly for demo purposes). In case you prefer to read vs. watch, a written version of the demo follows the video.
Situation:
00:02It’s been brought to my attention that in our community app, listings of past meetings (that were recently added by a new team member) feel notably slower than renderings of future meetings, and a quick glance at database utilization shows a rapid increase of queries since the new feature has been introduced.00:22I’ll use a custom test that will amplify the performance difference between the two cases, simulating fetching and rendering of 1000 meetings.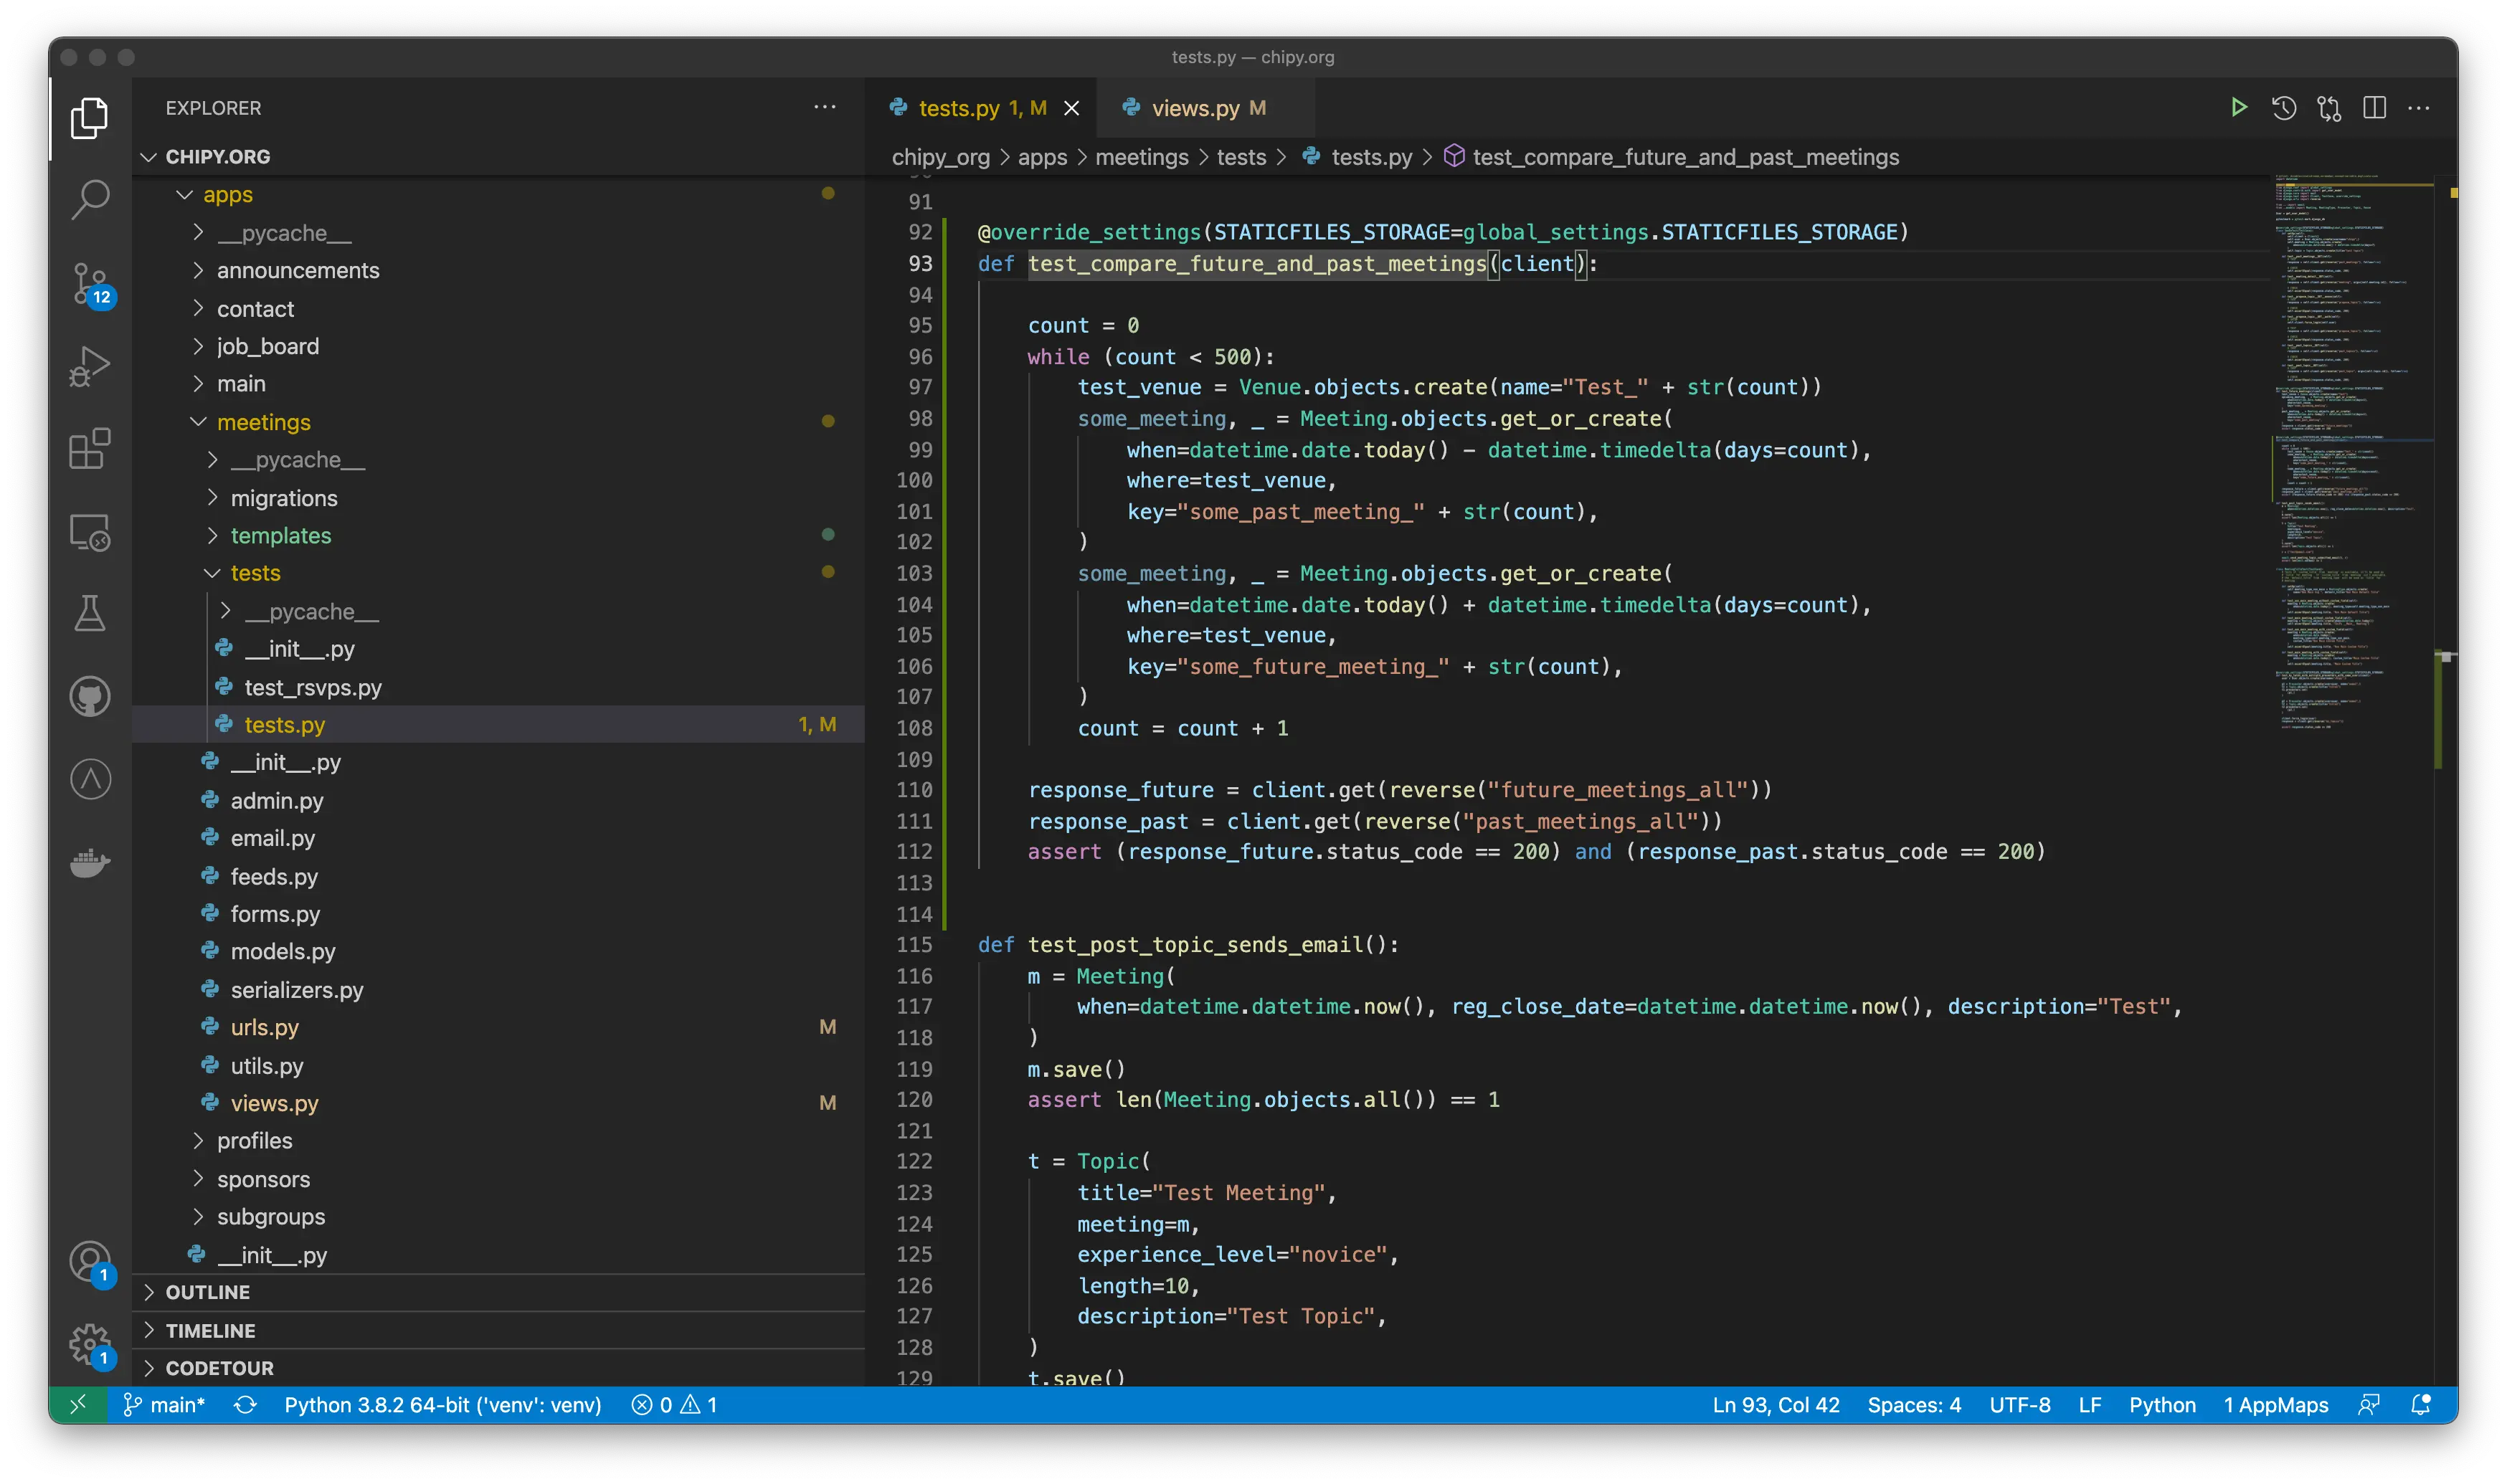
- To observe the behavior and measure the performance differences, I’m going to use the free and open source framework AppMap.
00:39Now let me run the test and see what’s going on in my application code: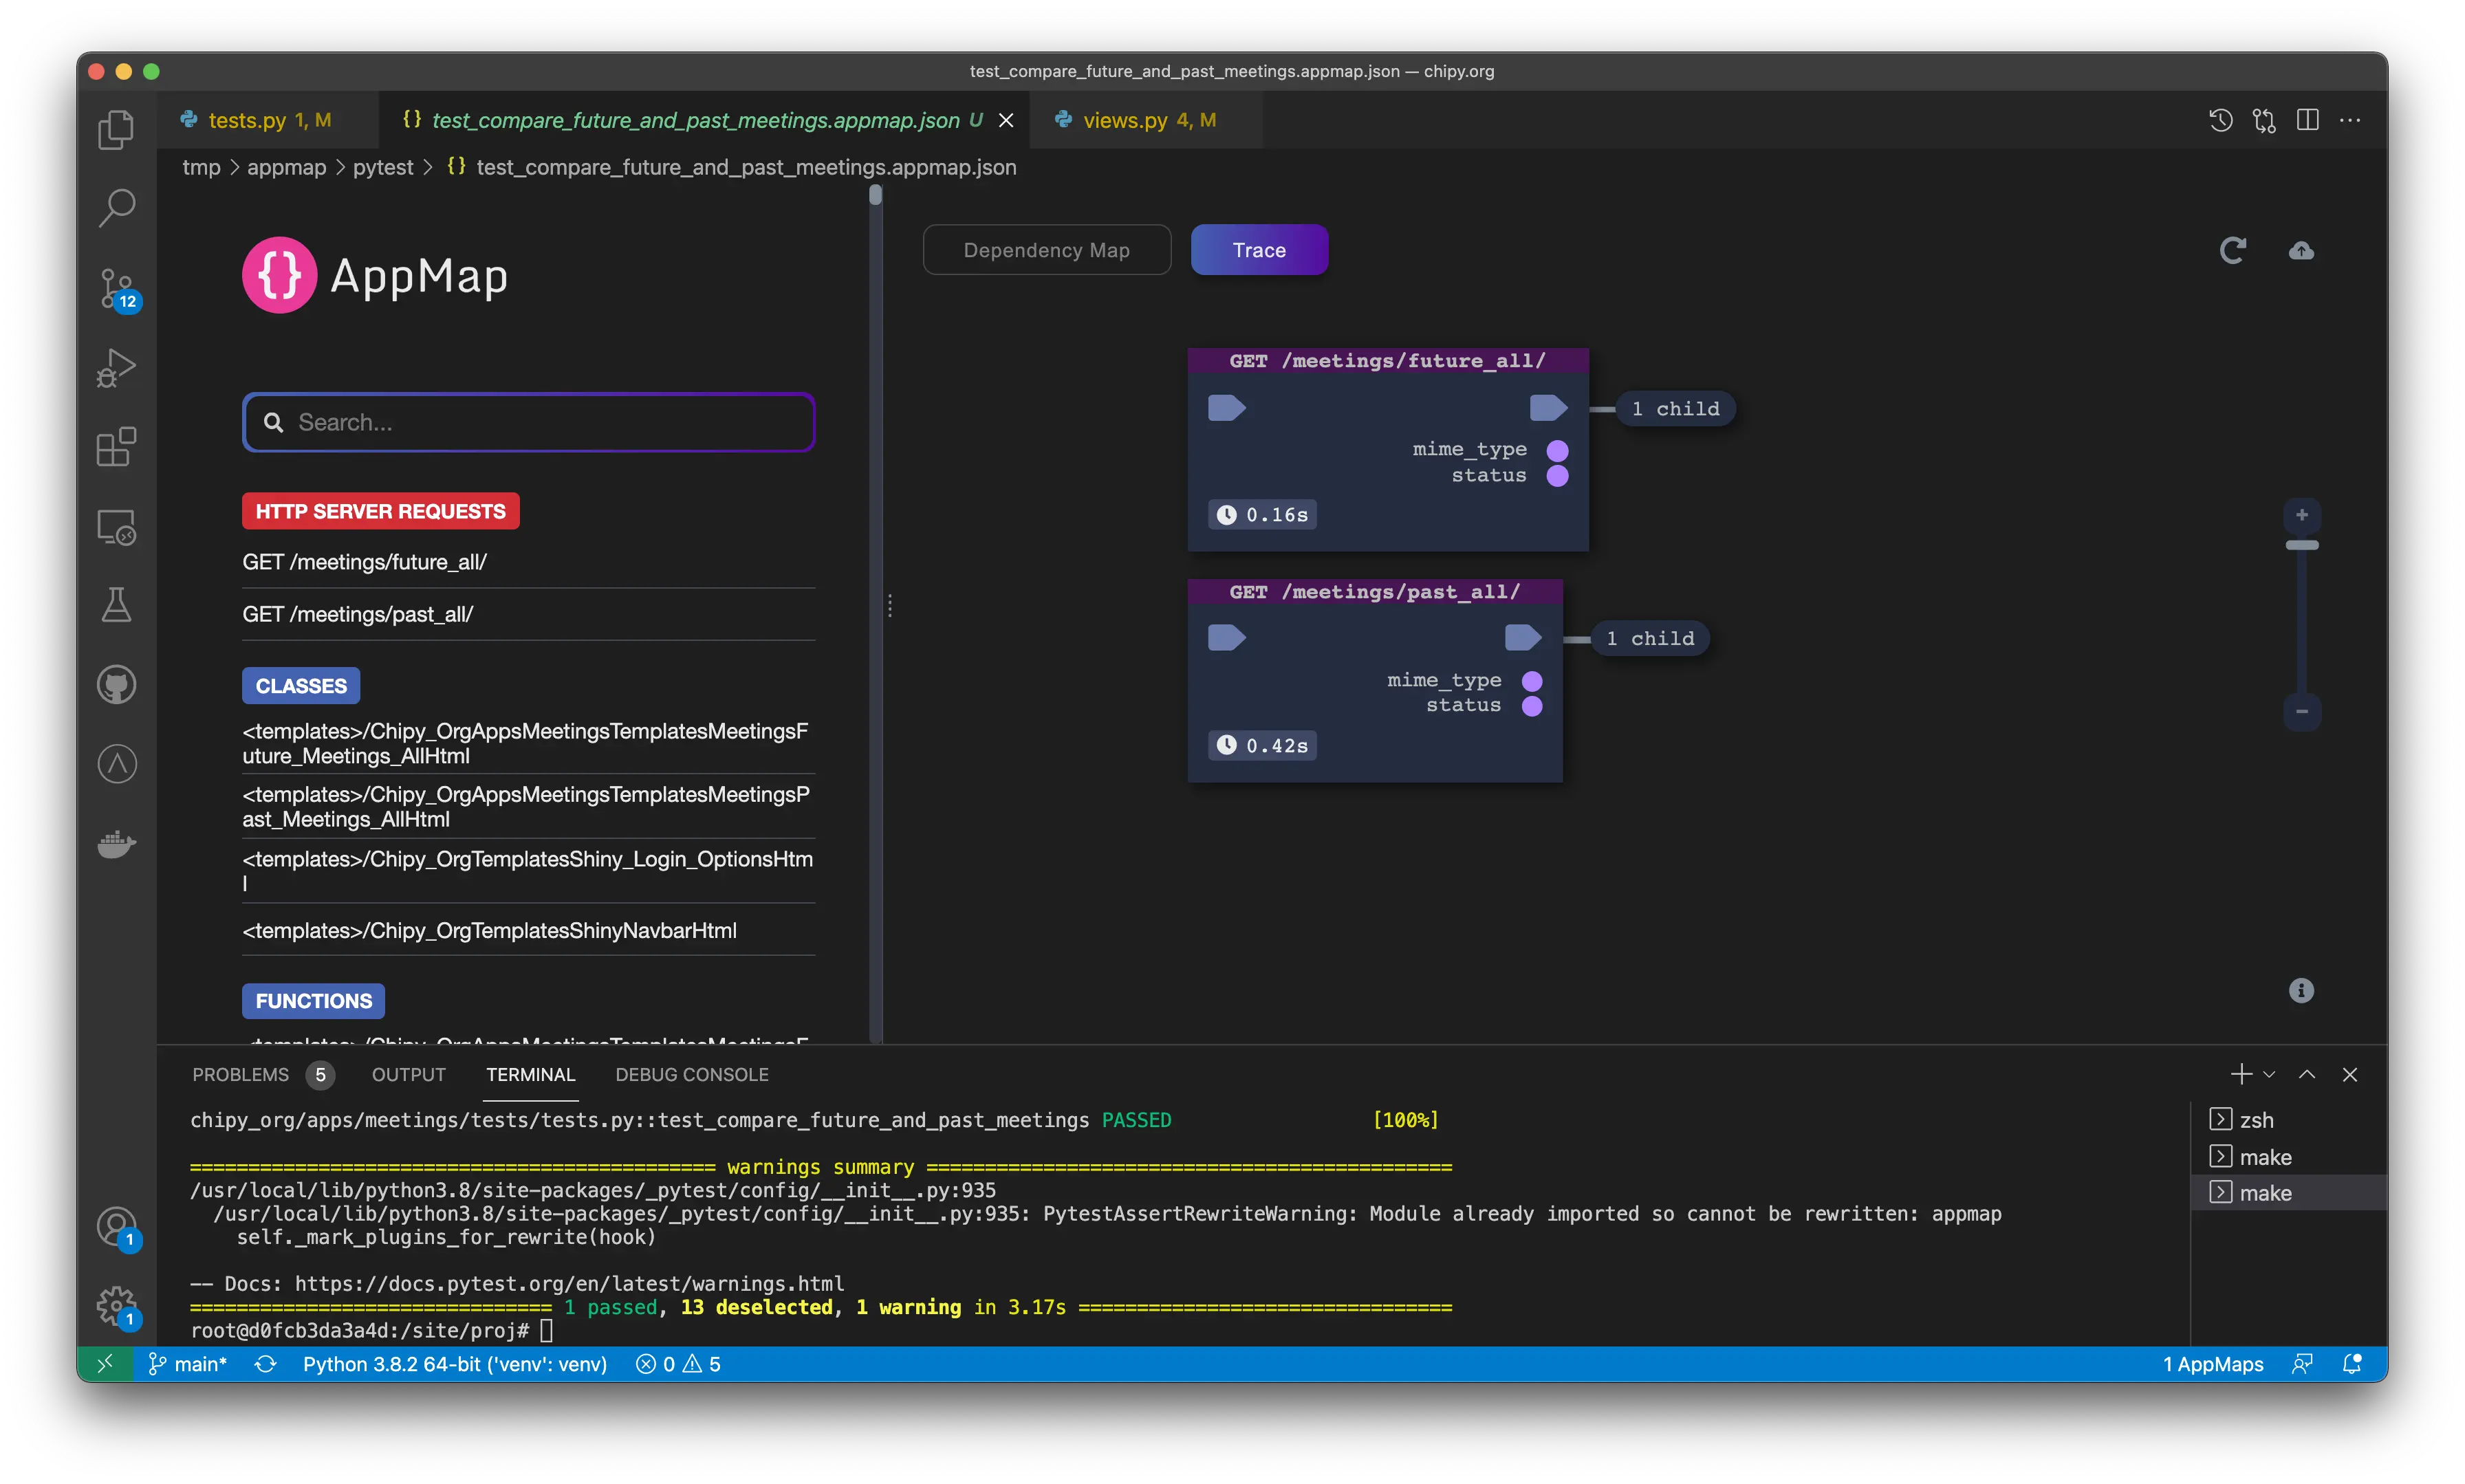
- Now this is interesting, because the future meetings took .16s while past meetings took a lot more time, .42s.
- Let’s drill down and compare the code flows of the two requests.
- This is a Django app and I can see that the renderer took .14s for future and .40s for past meetings. I can also instantly see that the first code flow has 4 children vs. 1500 of the second one.
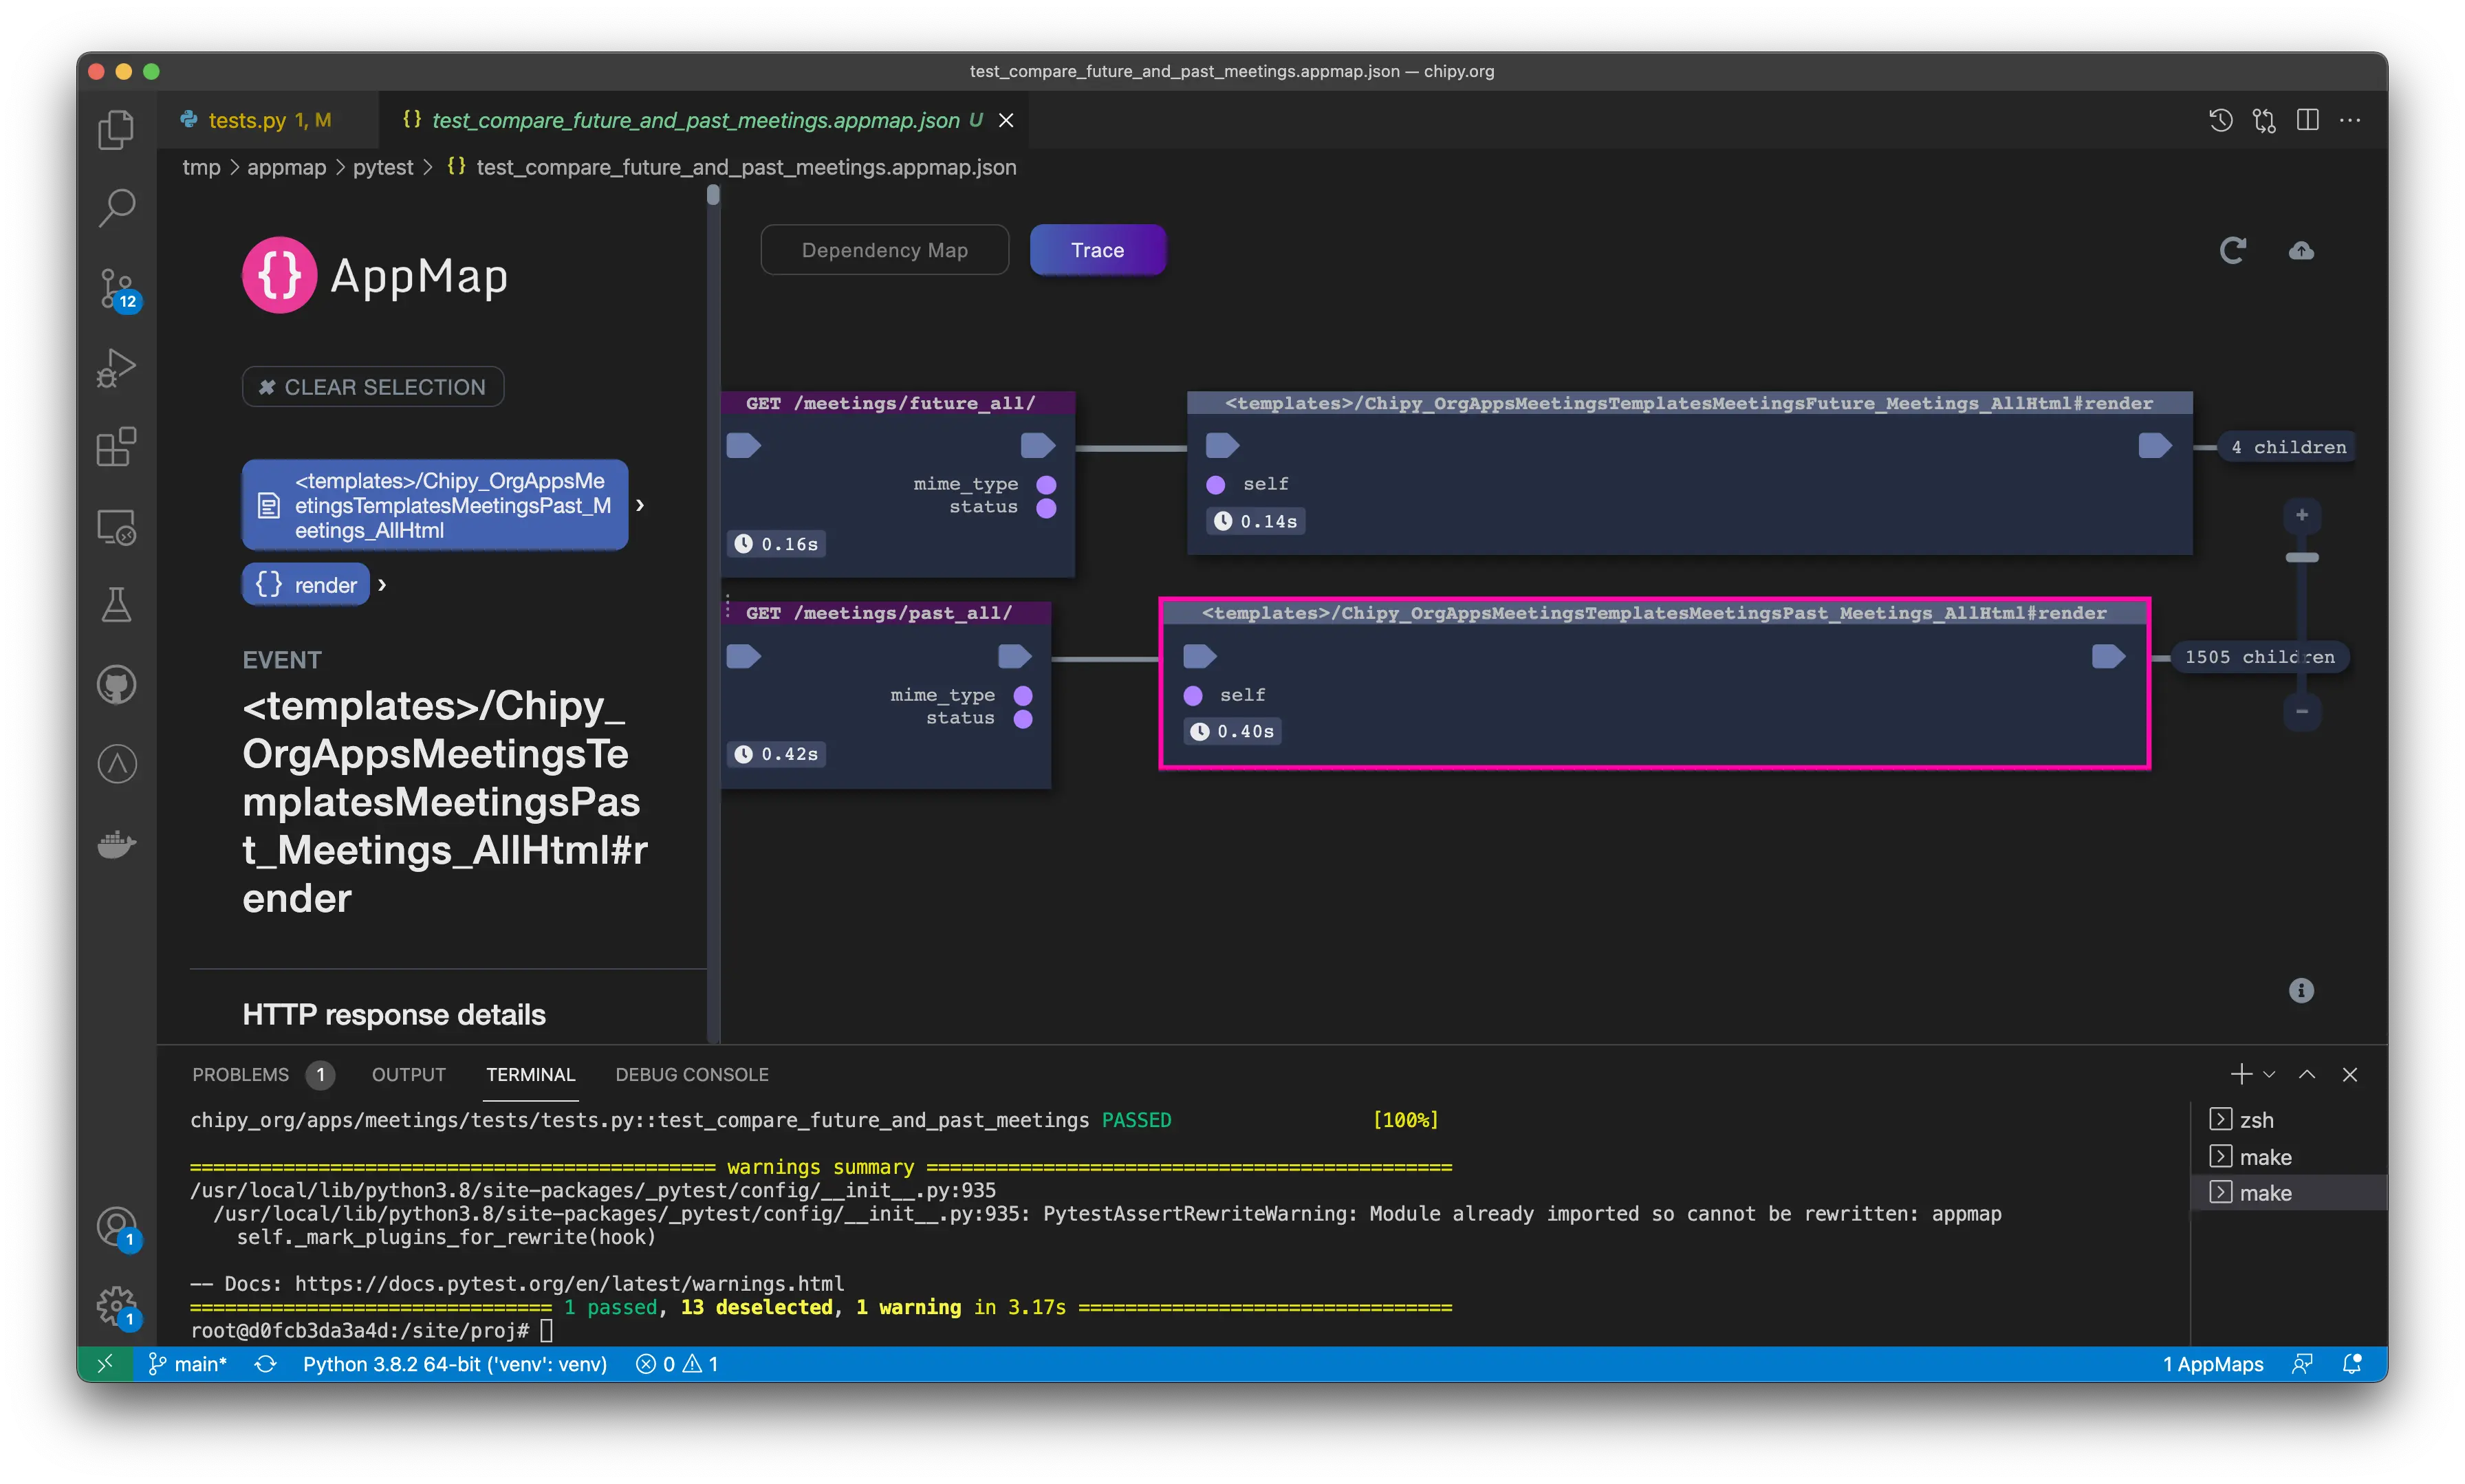
01:15Let’s look at the first flow, first.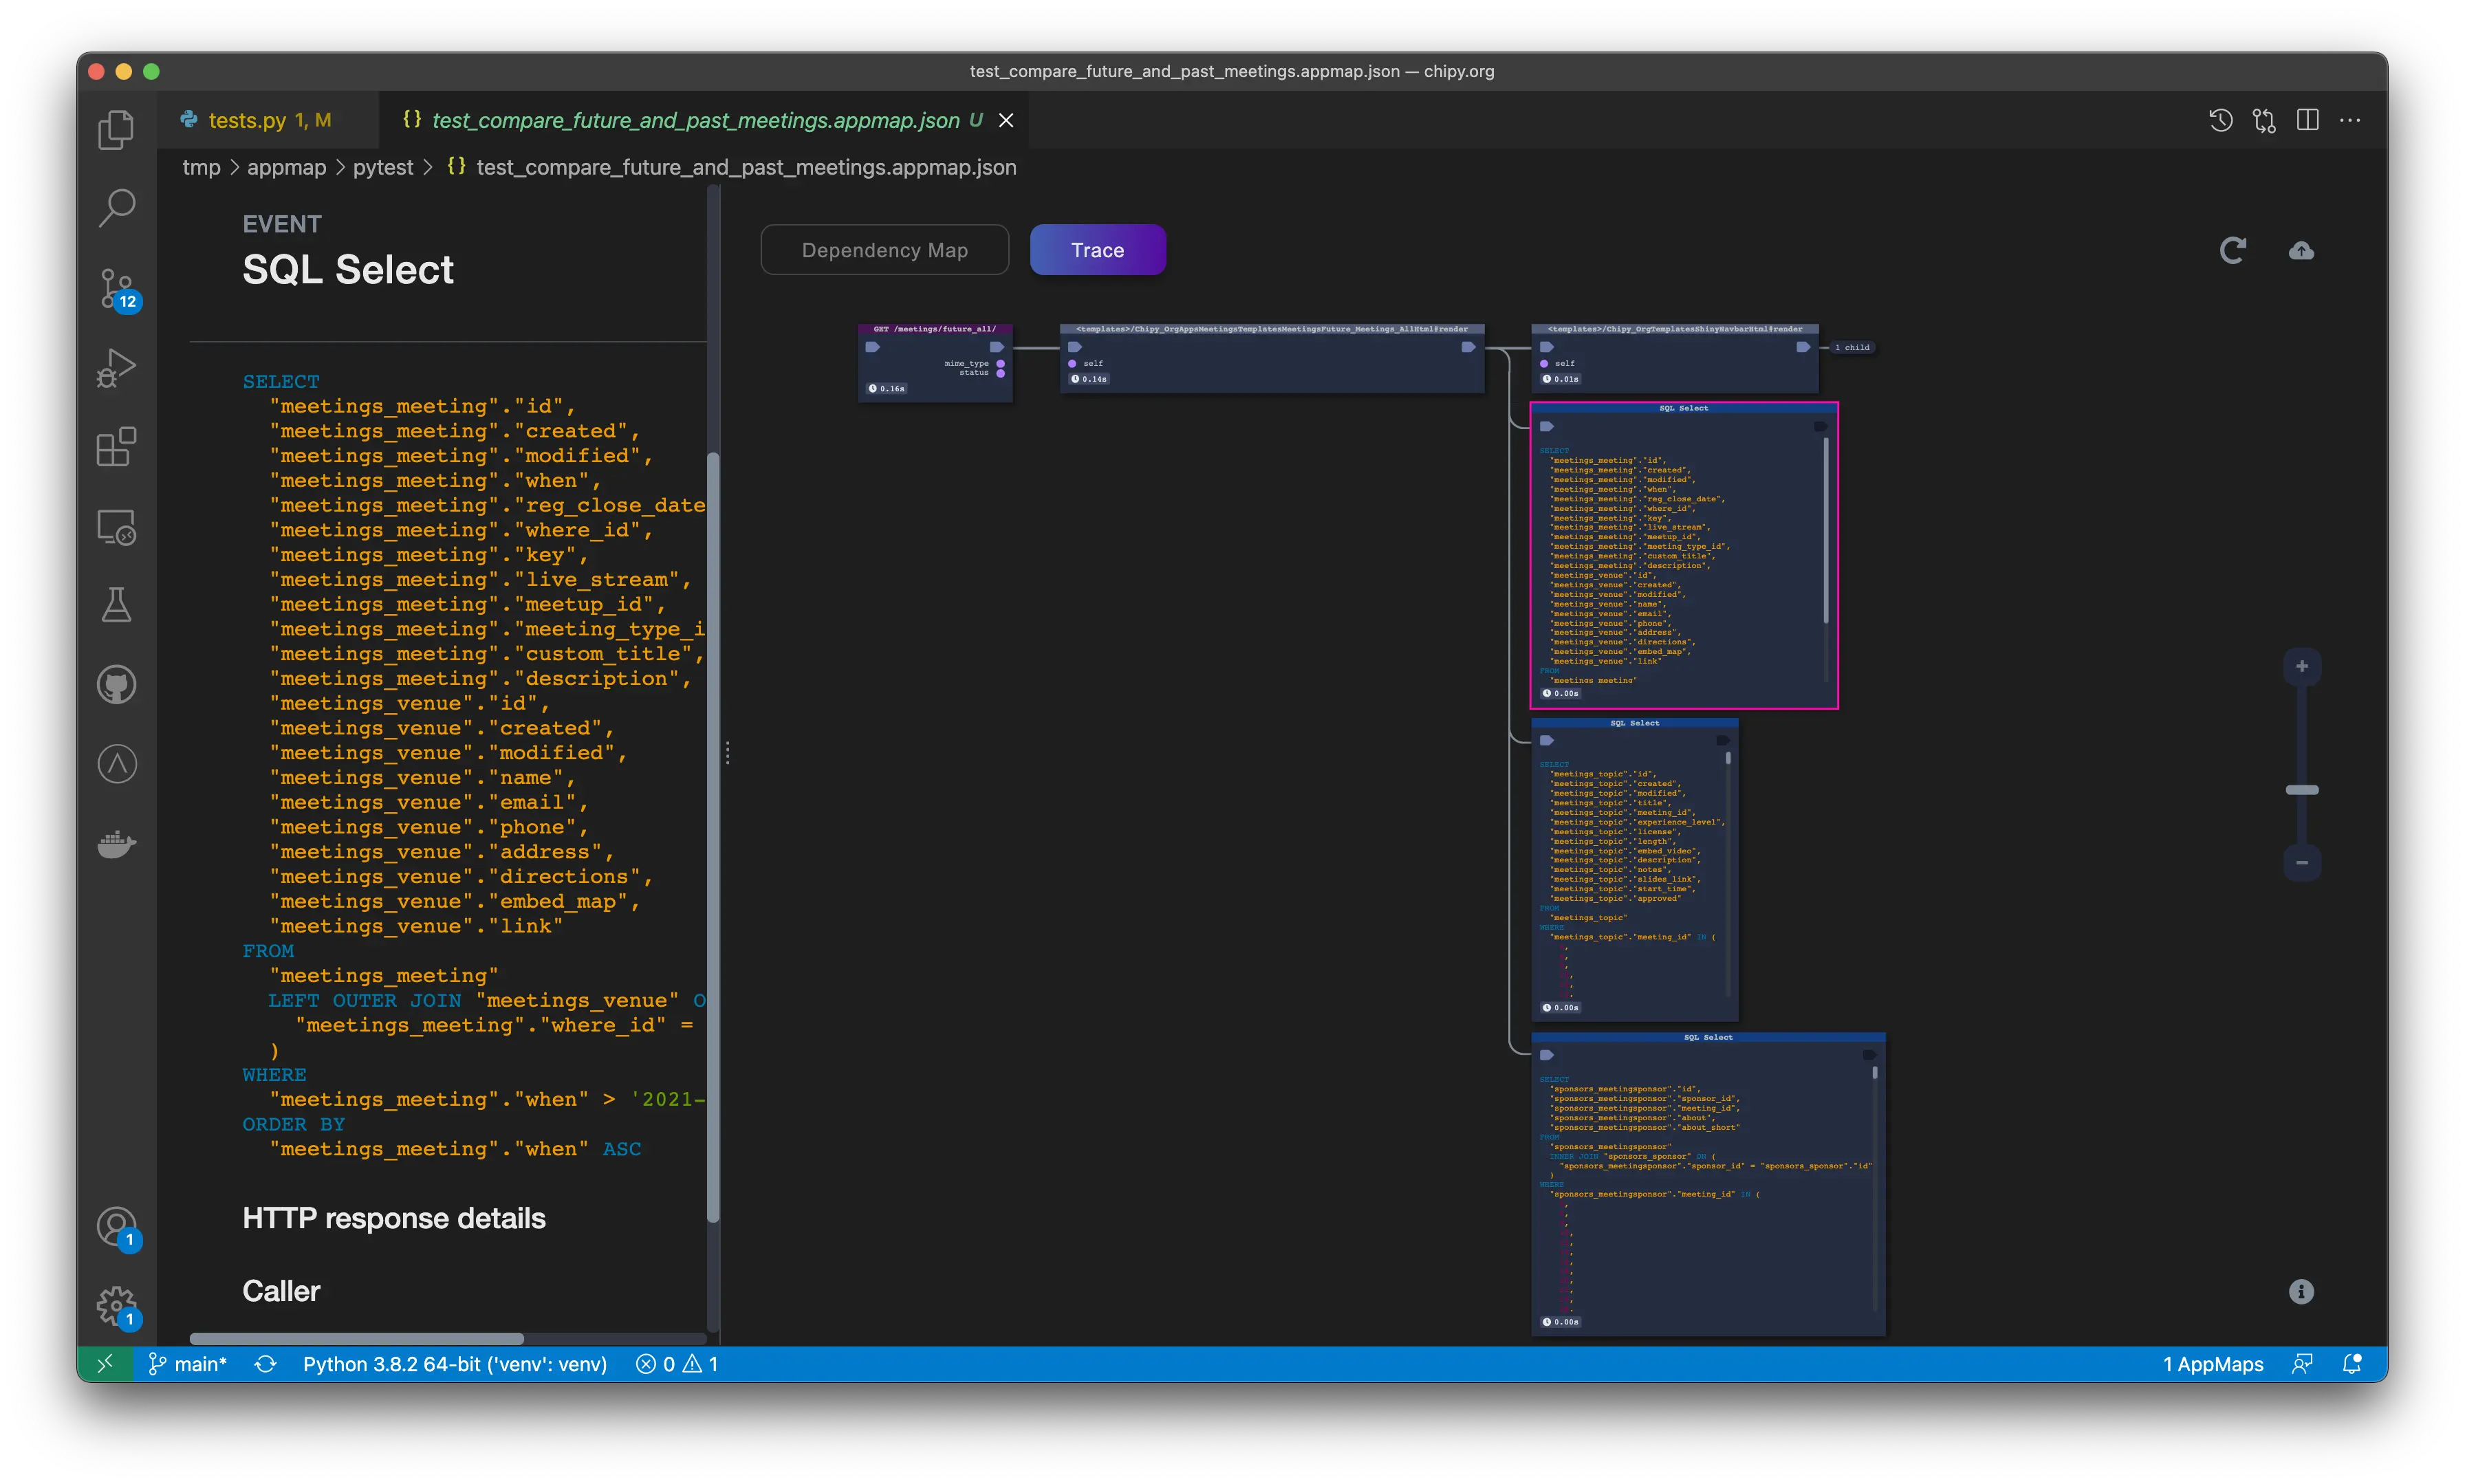 I can see that four SQL commands were executed for the future meetings request: The first lists all future meetings from the table, and the two following SQL commands pre-fetch data for all future meetings from related tables.
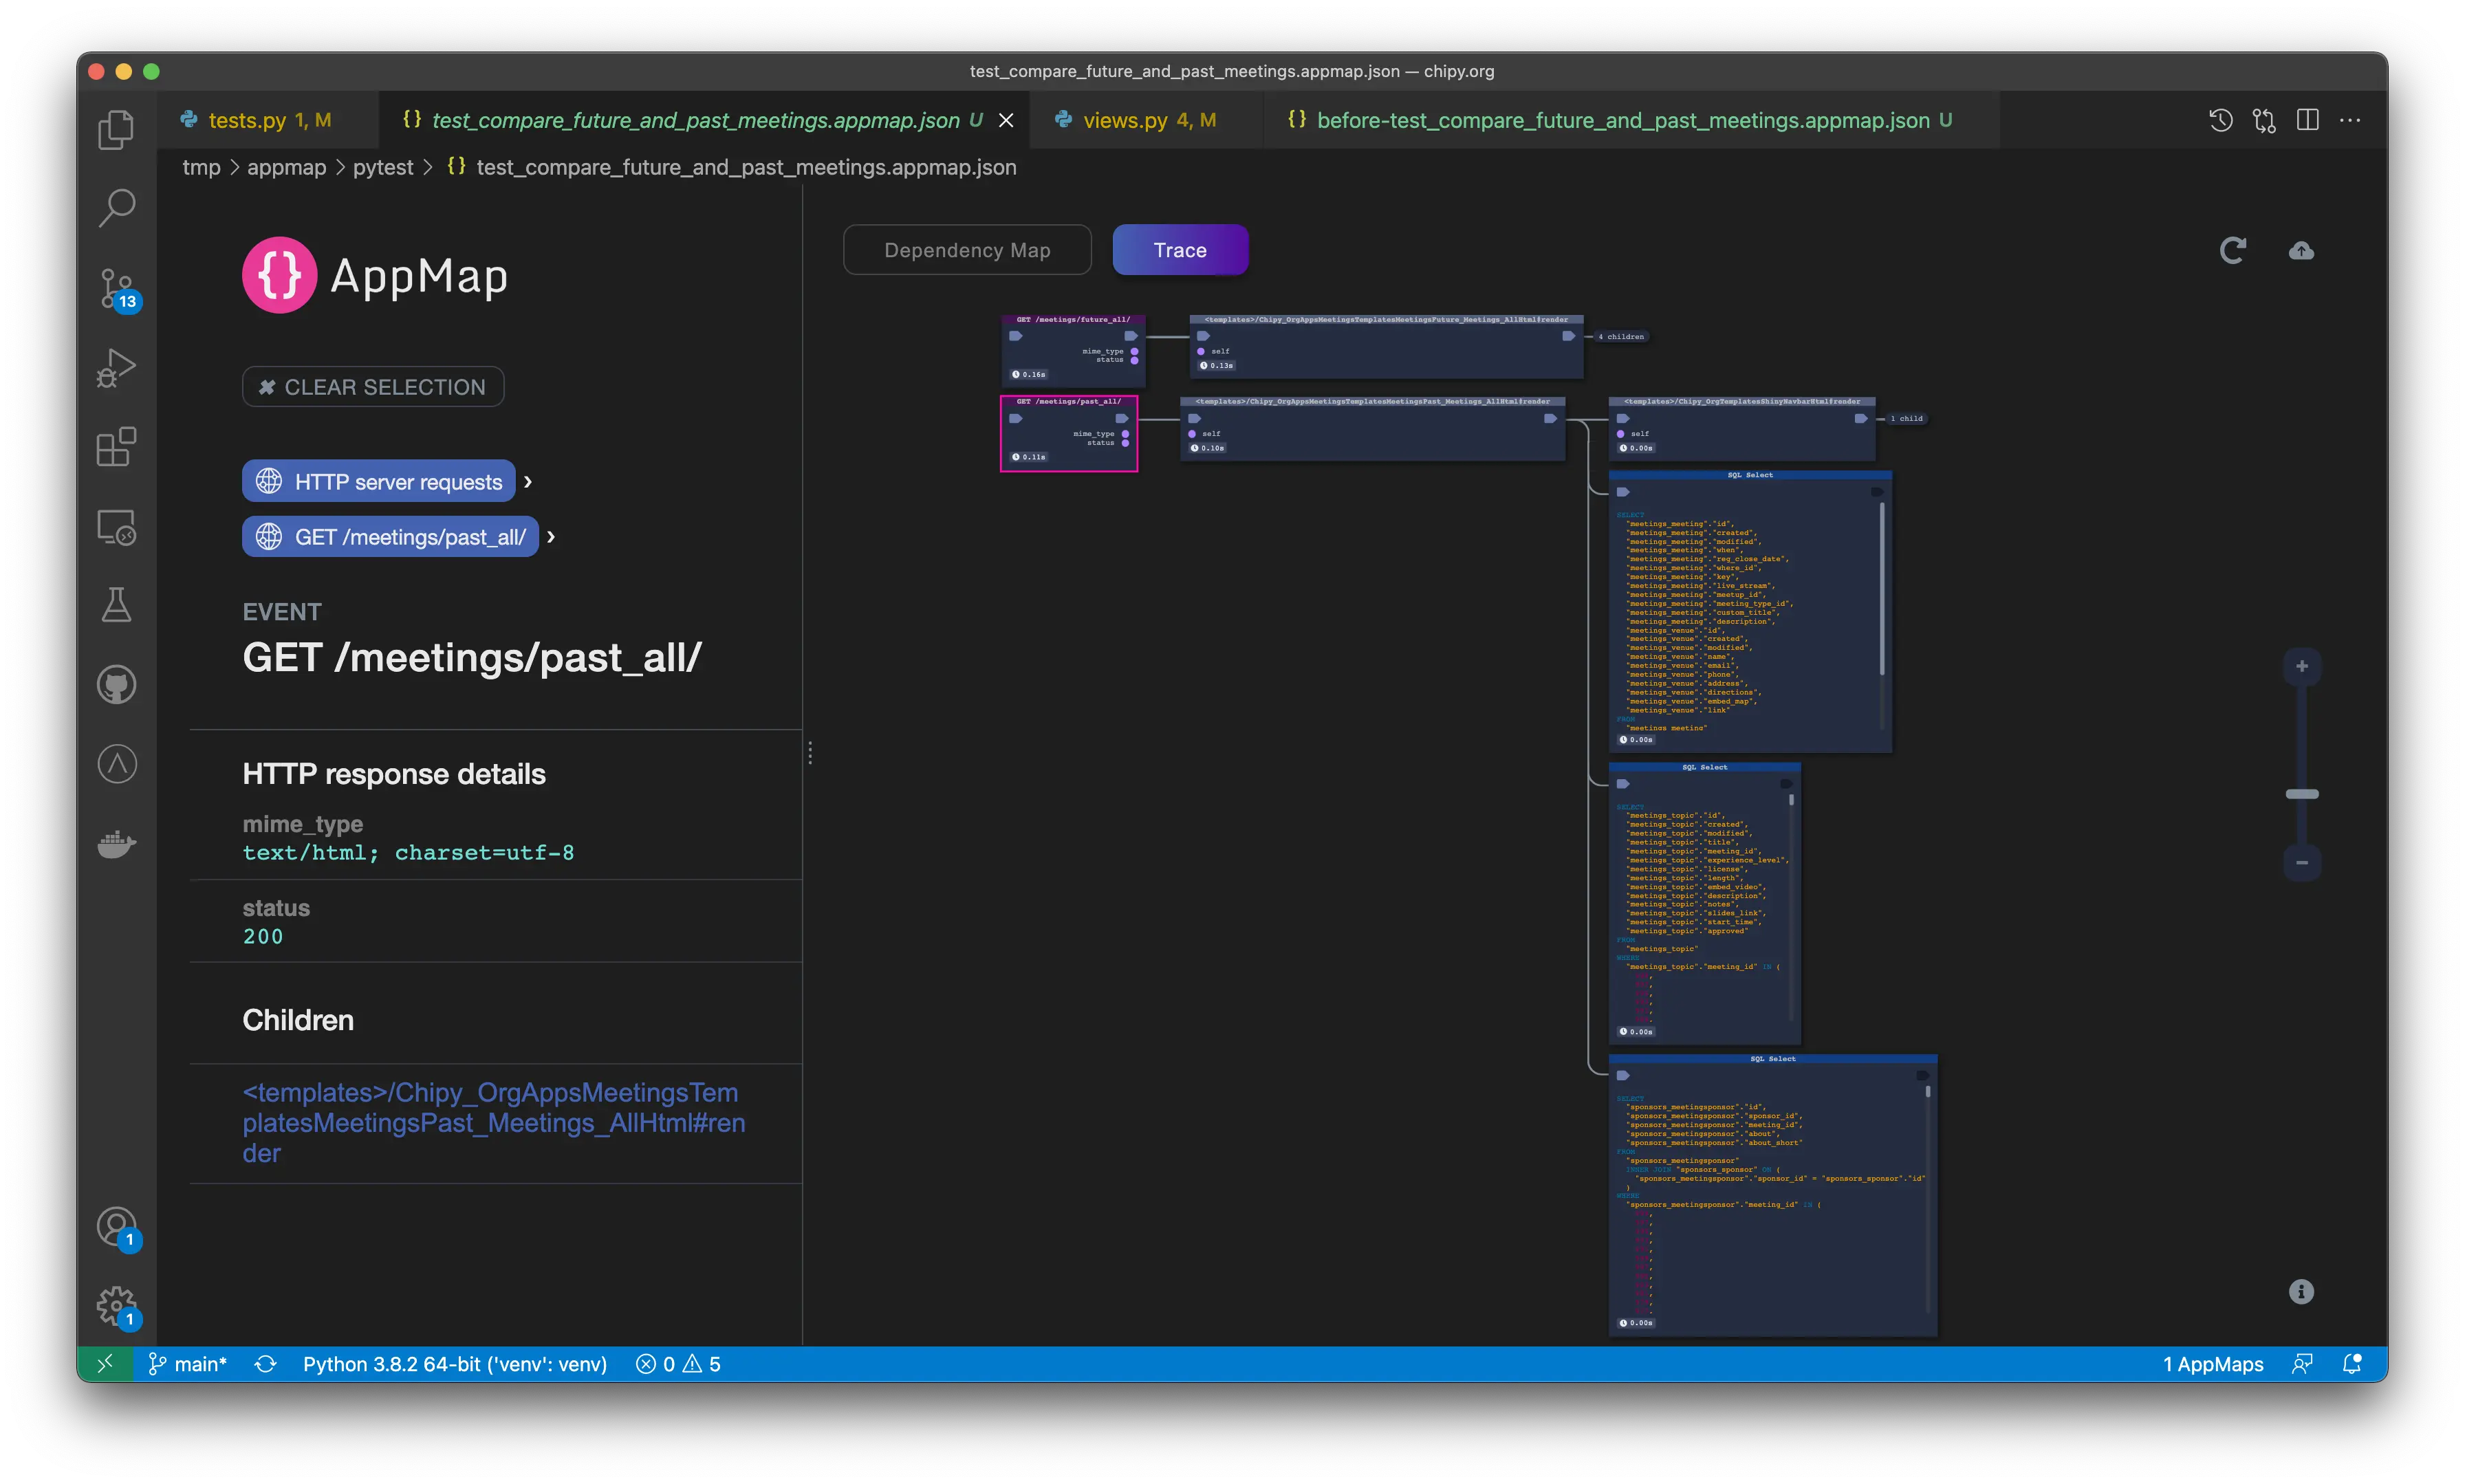
01:33Let’s drill down to the second flow, the request to view all past meetings. The second sequence starts with fetching all past meetings. What follows is very different though: The ORM runs three queries for each past meeting in the database – that’s 1500 trips to the database total for 500 past meetings created by the test. Even on my dev environment with no other database load, the performance difference between the two SQL command patterns is remarkable.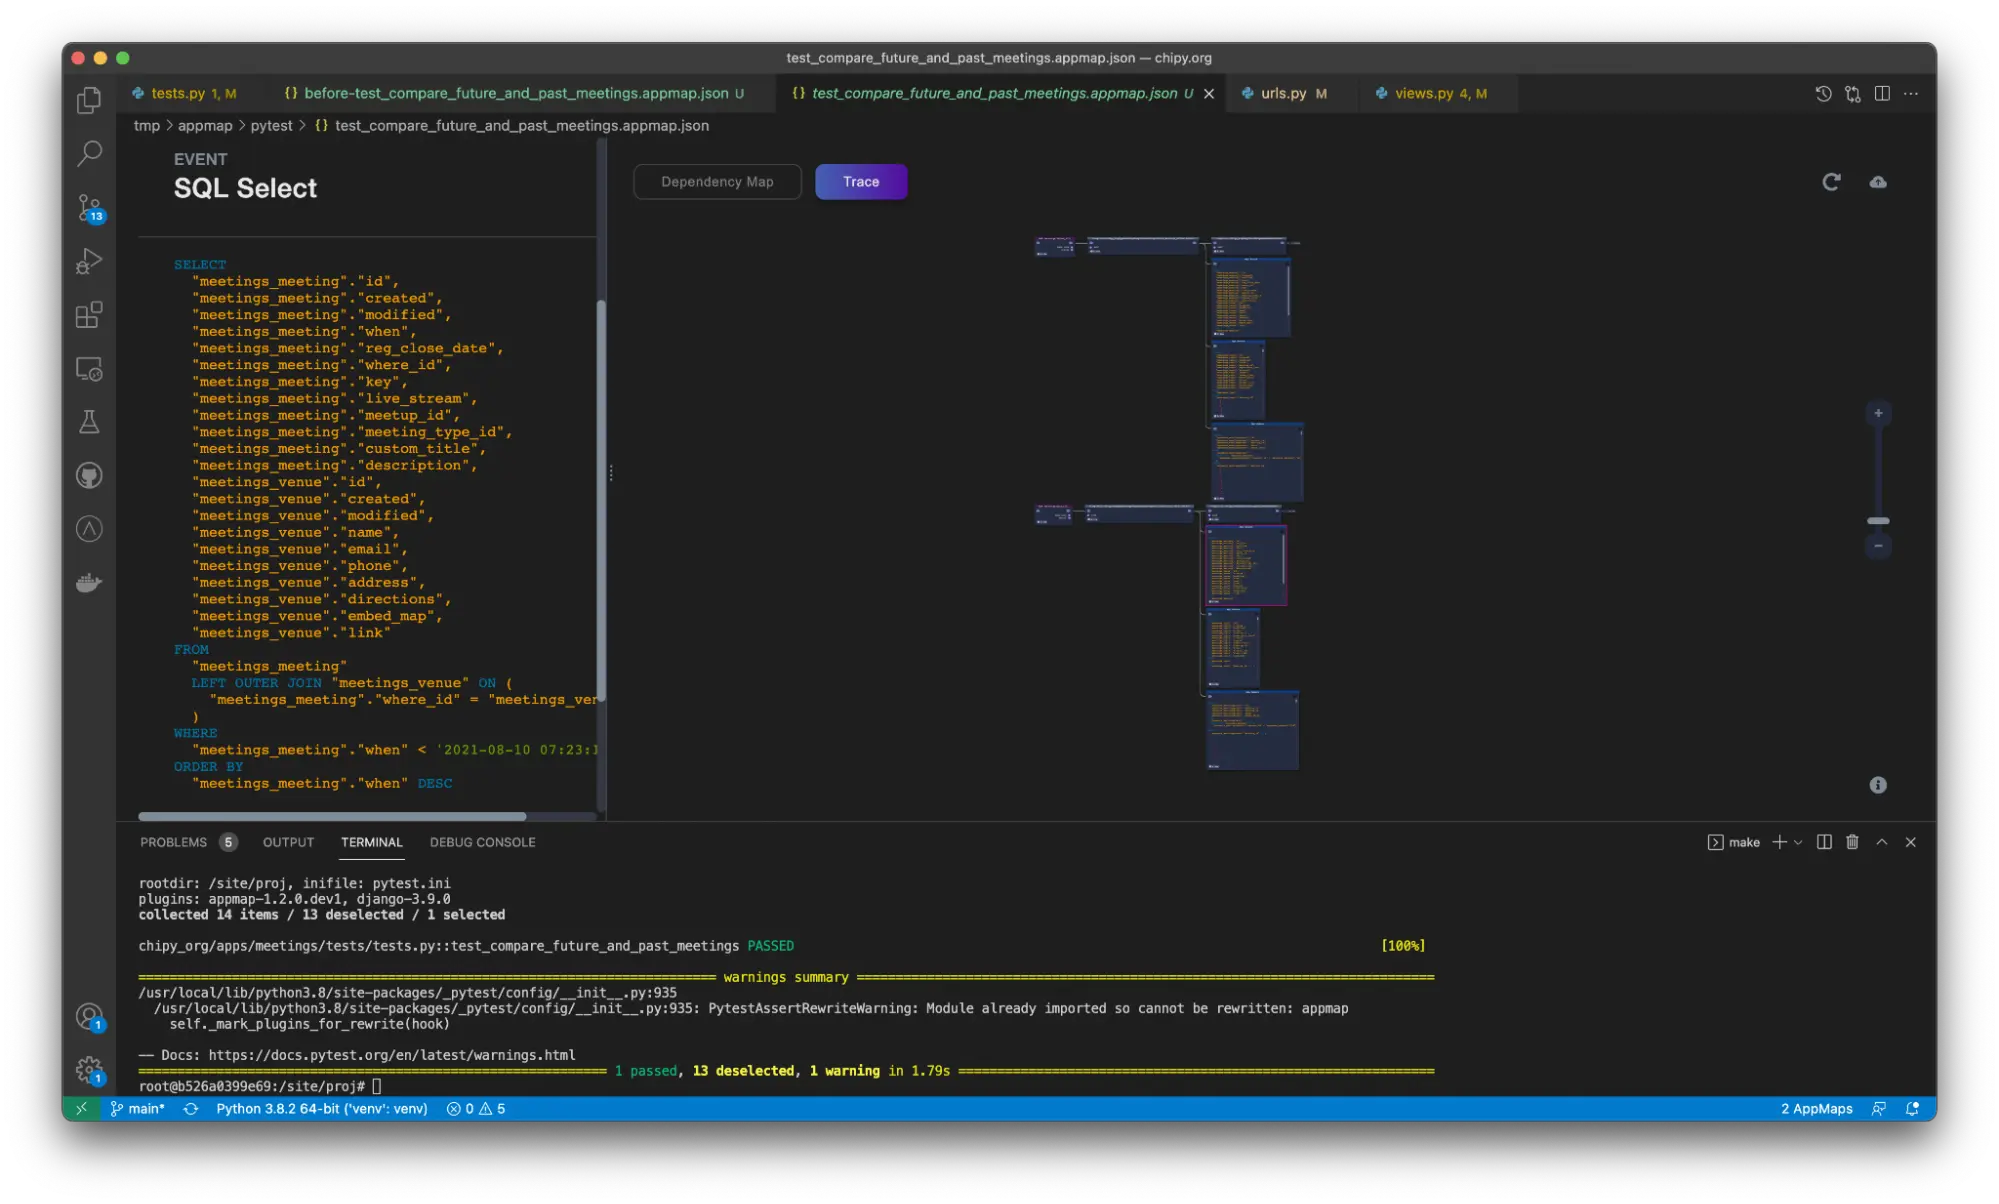
02:02Let’s see what happens in the code that sets up the data entities. A quick glance in the view implementation reveals that the past meetings view lacks theselect_relatedandprefetch_relatedmethod calls, causing the observed N+1 problem.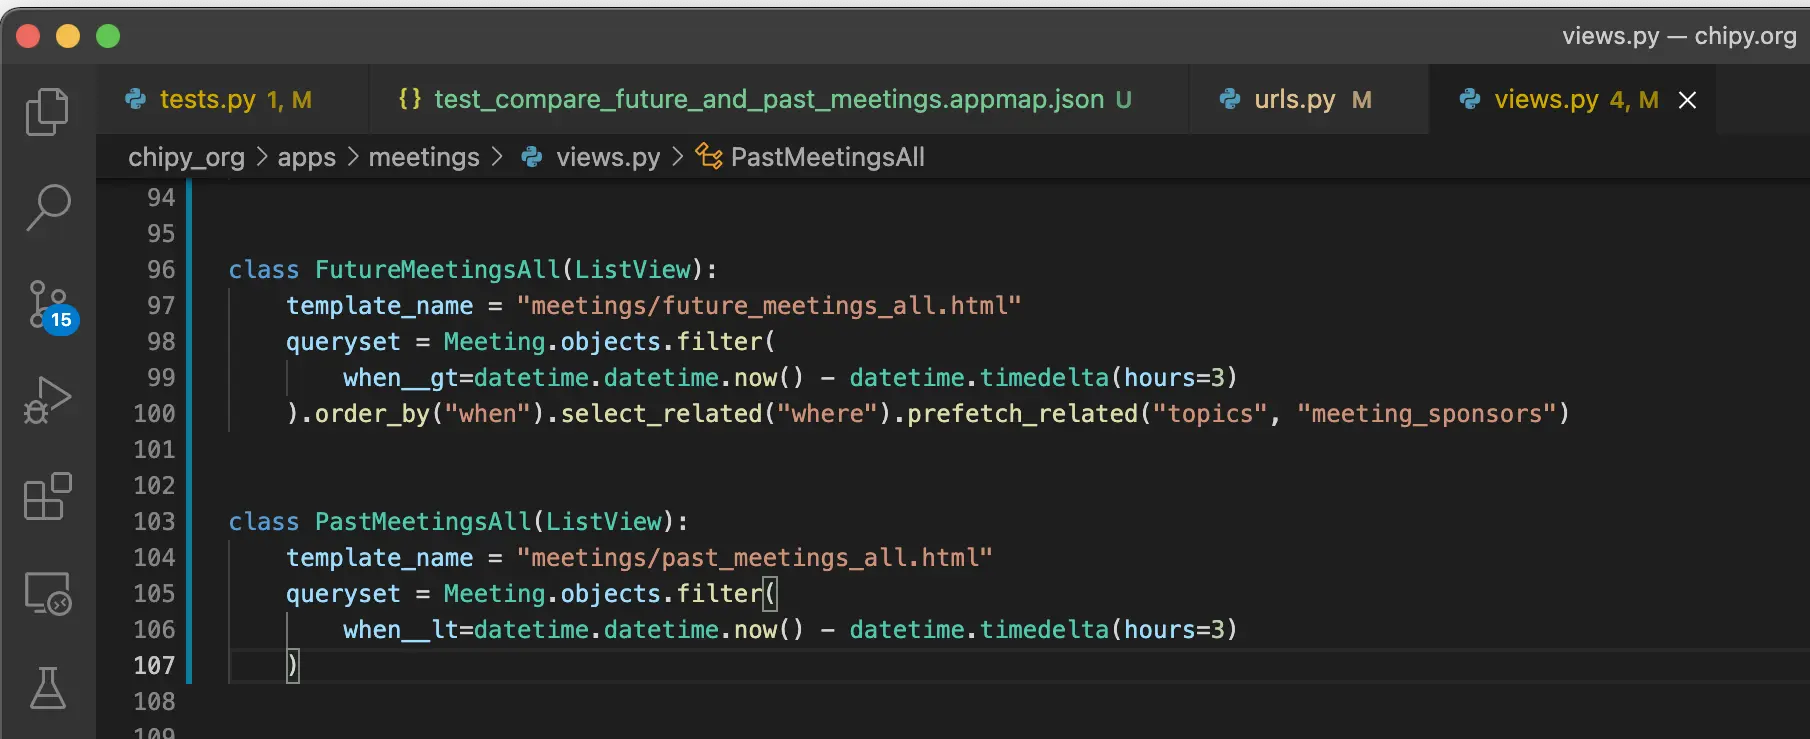
- Note that despite the obvious code issue, the tests were passing previously – functionally, the existing code worked – but it’s causing extra costs and risk, and puts an unnecessary strain on the database.
02:34Let’s fix and run the test again.class FutureMeetingsAll(ListView): template_name = "meetings/future_meetings_all.html" queryset = Meeting.objects.filter( when__gt=datetime.datetime.now() - datetime.timedelta(hours=3) ).order_by("when").select_related("where").prefetch_related("topics", "meeting_sponsors") class PastMeetingsAll(ListView): template_name = "meetings/past_meetings_all.html" queryset = Meeting.objects.filter( when__lt=datetime.datetime.now() - datetime.timedelta(hours=3) ).order_by("-when").select_related("where").prefetch_related("topics", "meeting_sponsors")02:50And here we can see that with the fix in place, the number of the database queries dropped, and the performance of the past meetings flow has improved dramatically.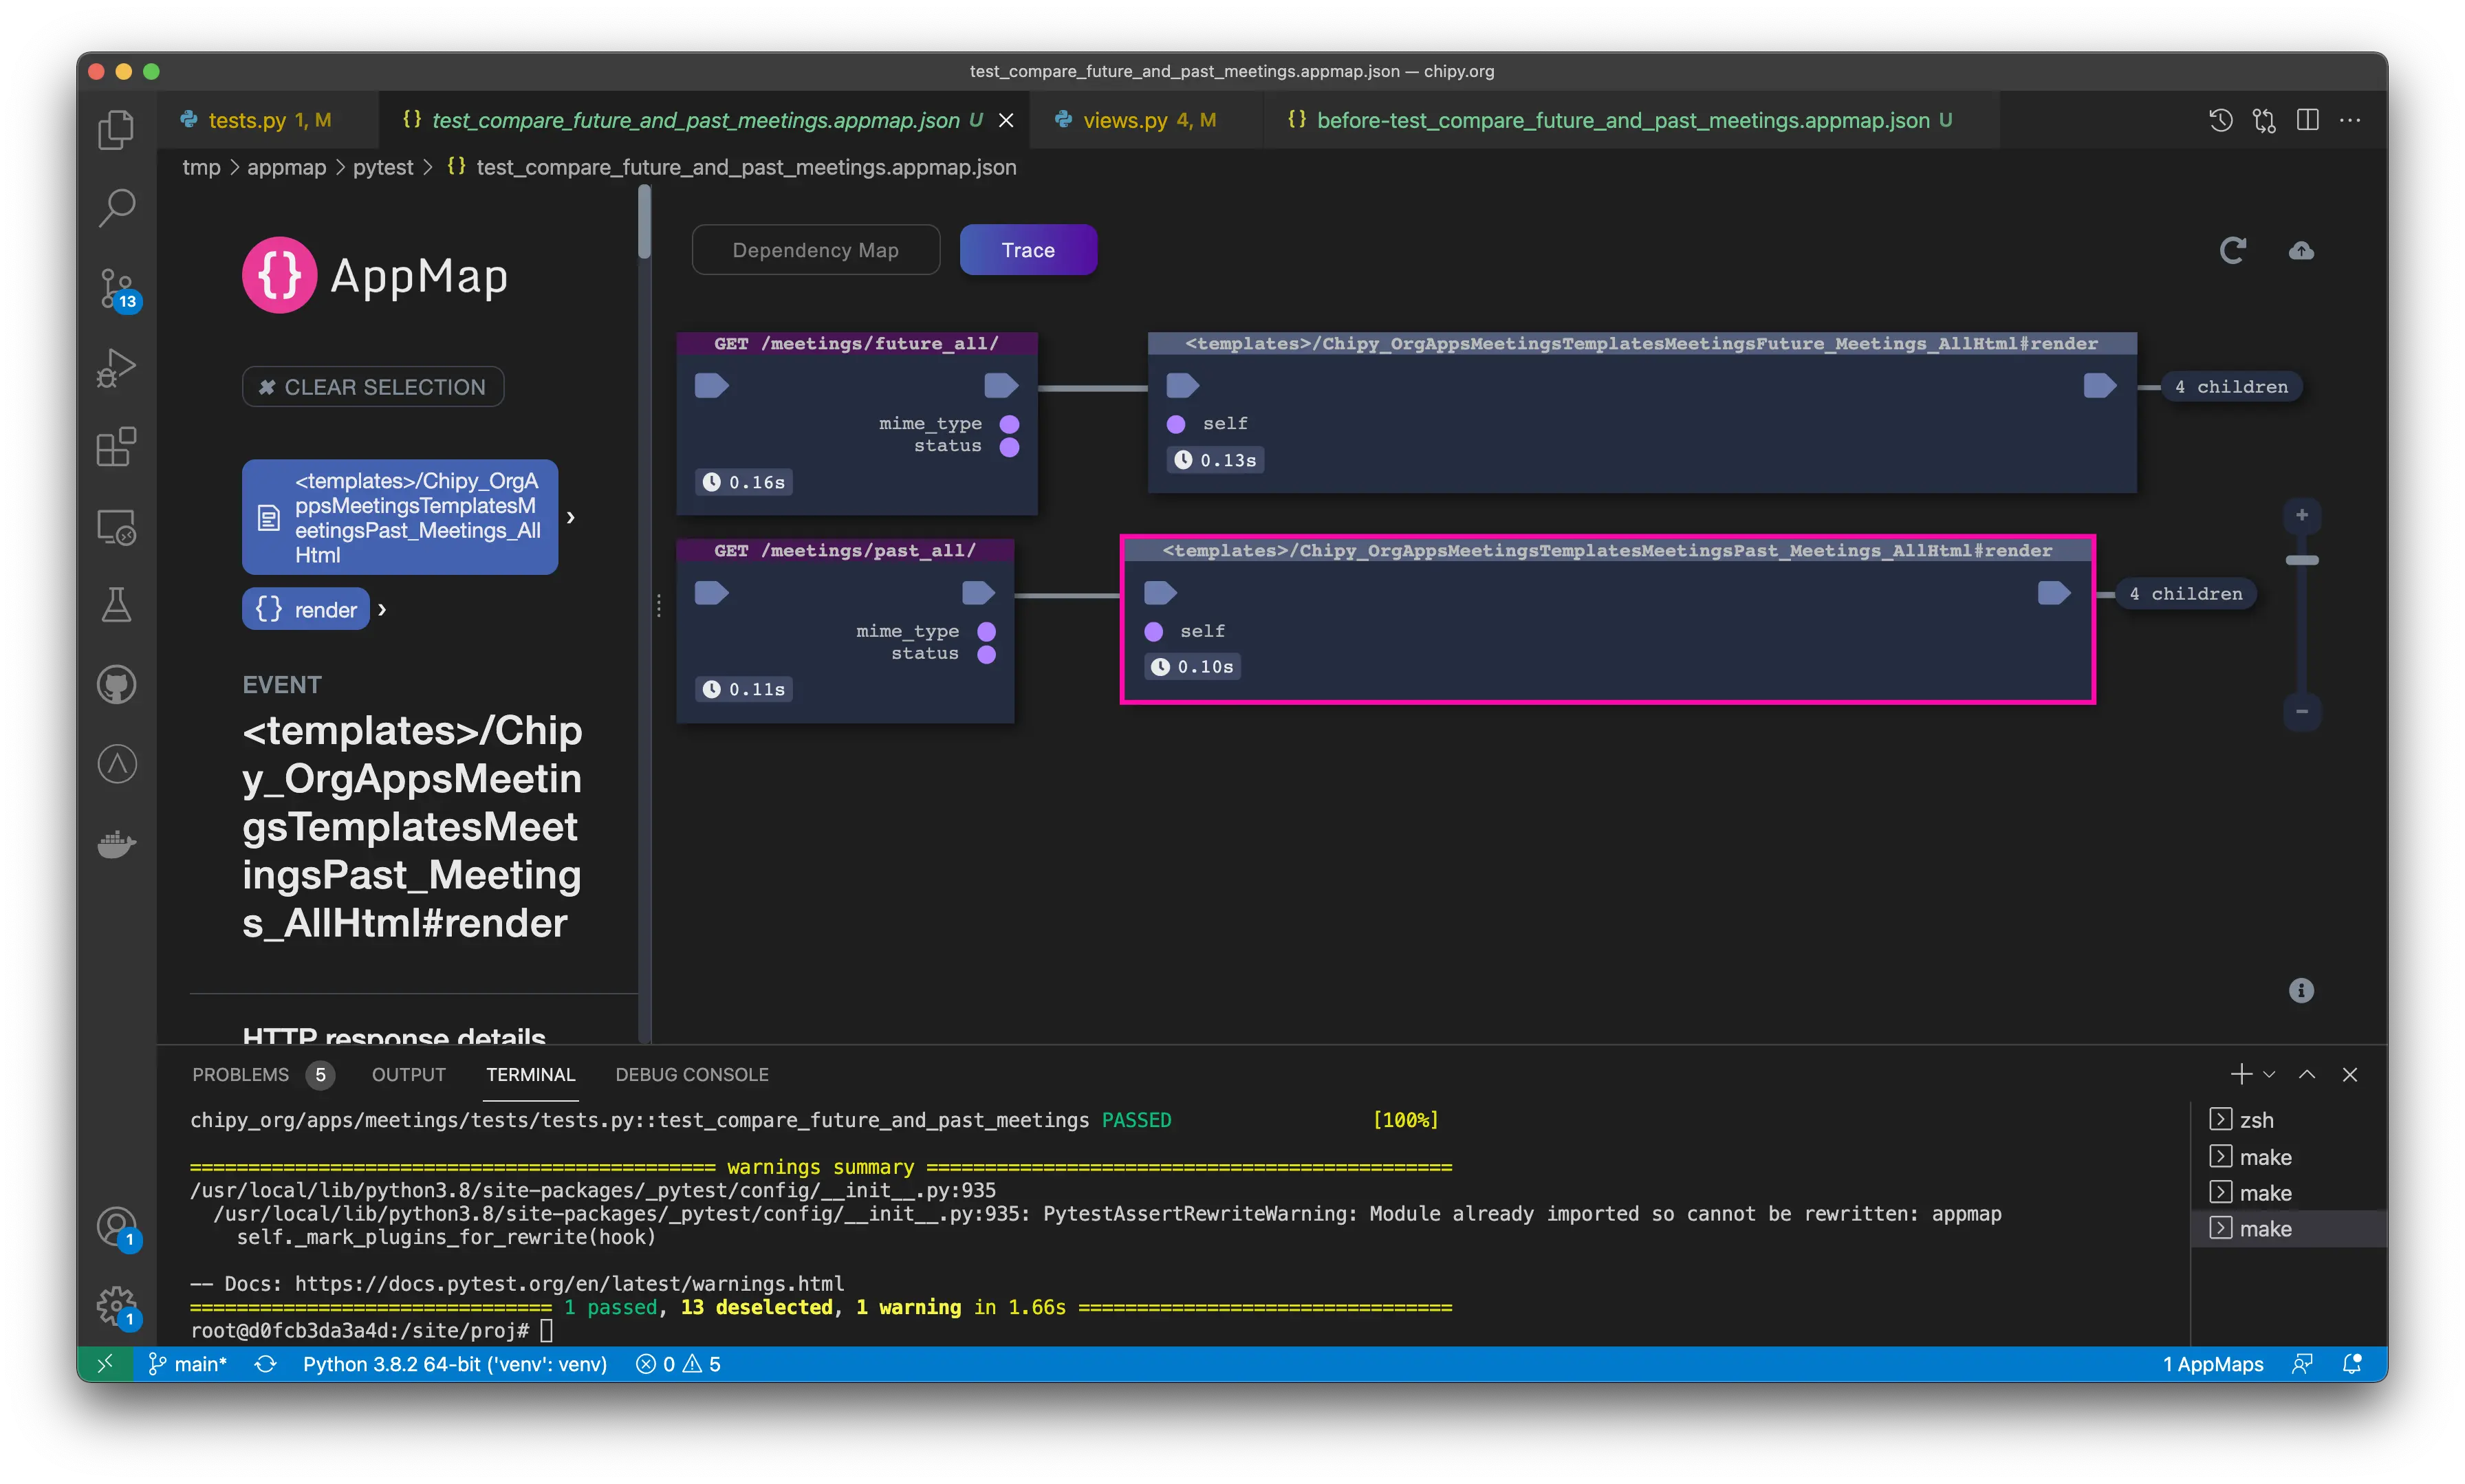
To recap this demo, AppMap helped me quickly identify a performance problem and verify a fix by providing me with all the clues required to discover and address the performance-impacting flaw in my code.
Questions or feedback? We’d love to hear from you – reach out in Slack or Twitter!